
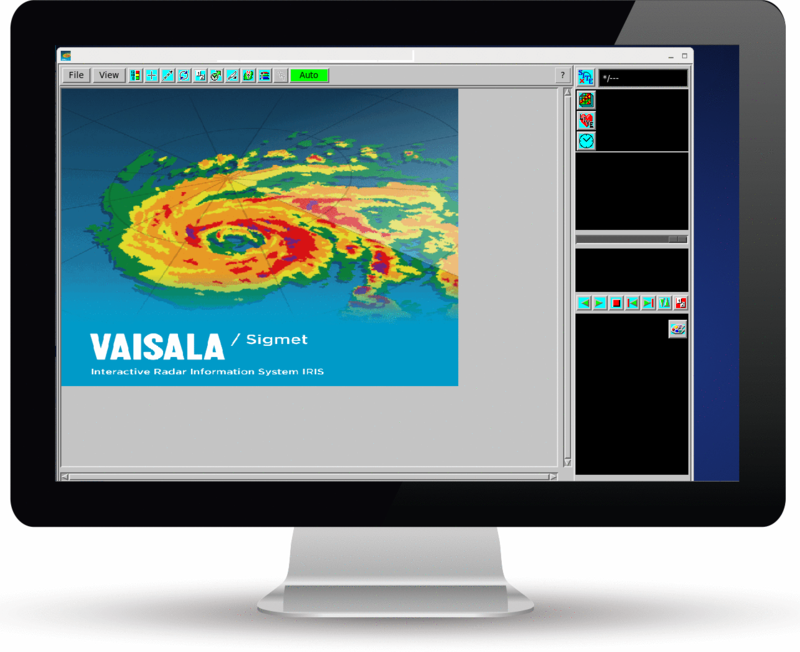
Real Time Display Menu
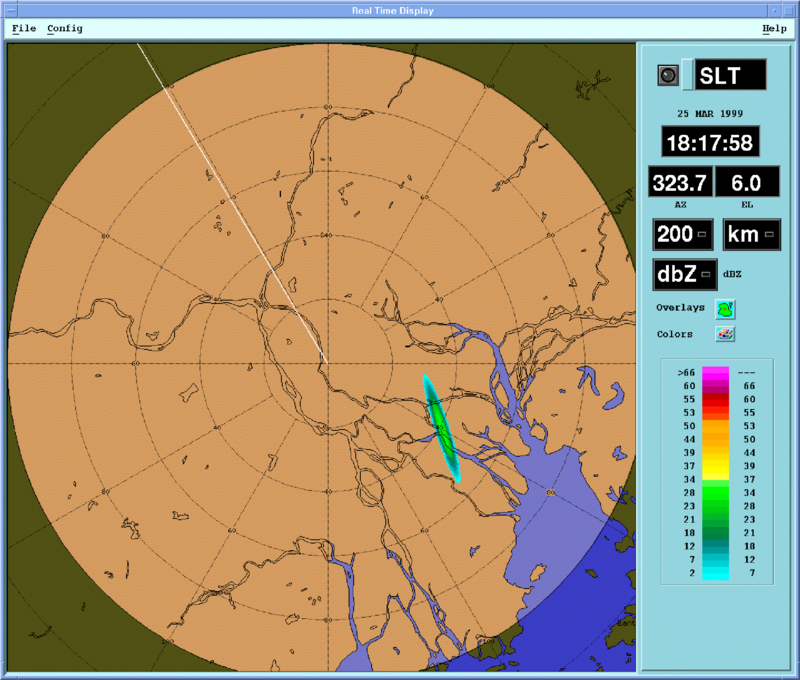
File Menu
The File menu allows you to open and save files and print real time display images.
Saved config files are stored in the ${IRIS_CONFIG} directory with names ending in .rtdisp.
Note that when rtdisp is started without an explicit configuration
name, it uses the DEFAULT configuration file.
 | Caution
Save as... is used to store your custom display configuration. You must select to save your changes permanently. |
Config Menu
Use the Config menu to change some basic parameters.
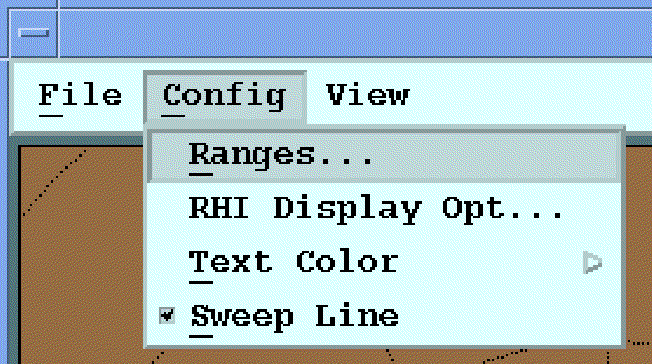
- Ranges
- Modifies the list of available display ranges.
- RHI Display Opt ...
-
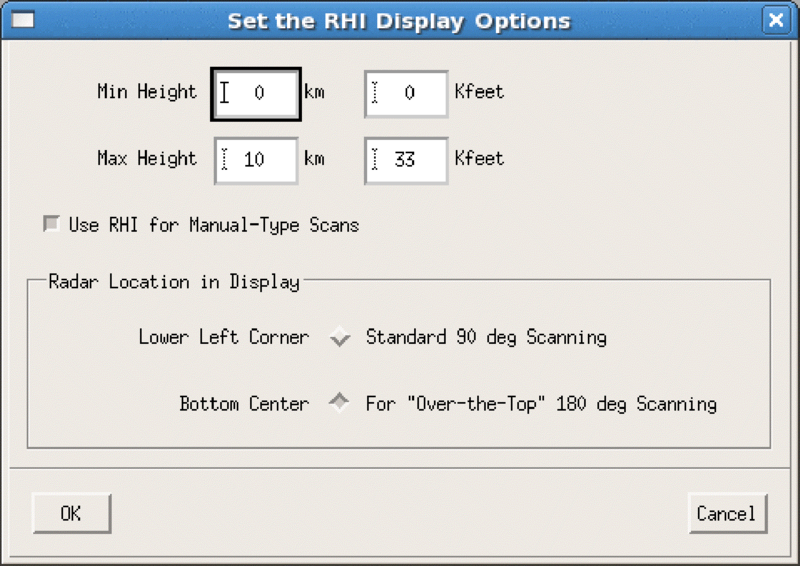
Sets the appearance of RHI displays:
- Max Height can be specified either in km or Kfeet, the latter is used if the horizontal range scale is selected to be nautical miles. The aspect ratio adjusts automatically.
- Min Height is normally set to 0. You can set it negative to handle banking on airborne radars.
- Use RHI for Manual-Type Scans
By default, IRIS Manual scans are displayed in PPI format. You can override the default to cause manual scans to be displayed in RHI format.
- Depending on the antenna capabilities, select either a standard 90° scan or an "Over the top" 180° scan depending on the antenna capabilities.
- Text Colors
-
Chooses color for text in AZ/EL, and similar display.

The large format numerals in the Real Time Display are designed to be read from several meters distance.
You can change the color of the numerals using .
- Sweep Line
- Enables/disables a line showing the radar sweep.
 Status LED
The LED at the top of the display shows the status of the data stream to the real time display.
- Fixed red on start up indicates that no data are being sent, or that data have not been received for 5 minutes (time-out). For diagnostic information, see Configuring Real Time Display Transmitter.
- Flashing green indicates that data are currently being received.
- Fixed green indicates that data are not currently being received, but data have been received within the last 5 minutes.
 Site ID Field for Multiple Radars
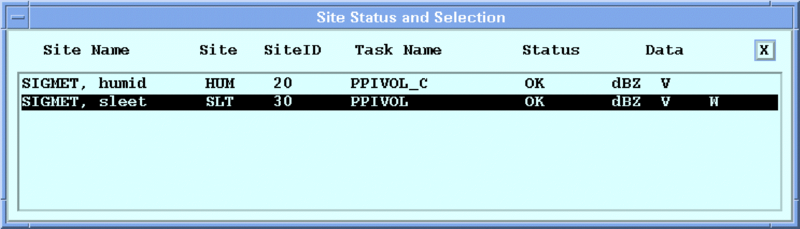
This field shows the 3 letter radar site ID. For installations that have more than one radar, this field can be used to select which radar is viewed on the real time display.
If you have multiple radars, select the button to the right of the LED to get a list of sites and select the site that you want to display.
 Time Display
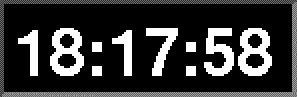
The data time (not the local workstation time) is displayed to the nearest second in large format numerals.
This updates approximately once per second when data are arriving.
When no data are arriving, the display time does not update so that the time reflects the data that remain on the screen.
The date of the data is displayed in smaller characters above the time.
 AZ/EL Display
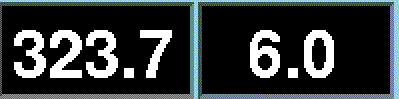
Azimuth and elevation angles are displayed to the nearest tenth degree in large format numerals.
This updates approximately once per second when data are arriving.
When no data are arriving, the angles do not update so that the elevation angle reflects the data that remains on the screen.
 Maximum Range
One of four maximum ranges can be selected by clicking on the numerical field under the AZ/EL display.
To set these ranges and the units, use .
 Data Selection for Display
Select this field to select the type of data for display. The choices are:
- dBZ
- Velocity
- Width
After you make your selection, the display resets and starts painting the new data type.
| Caution If the radar system IRIS is not configured to collect and transmit the selected data type, then no data is displayed. See Configuring Real Time Display Transmitter. |
 Overlays
The overlay features for the real time display include:
- Geographic overlays
- Range rings or lat/lon lines
To access these options, select the Overlays button to access the Overlays menu.
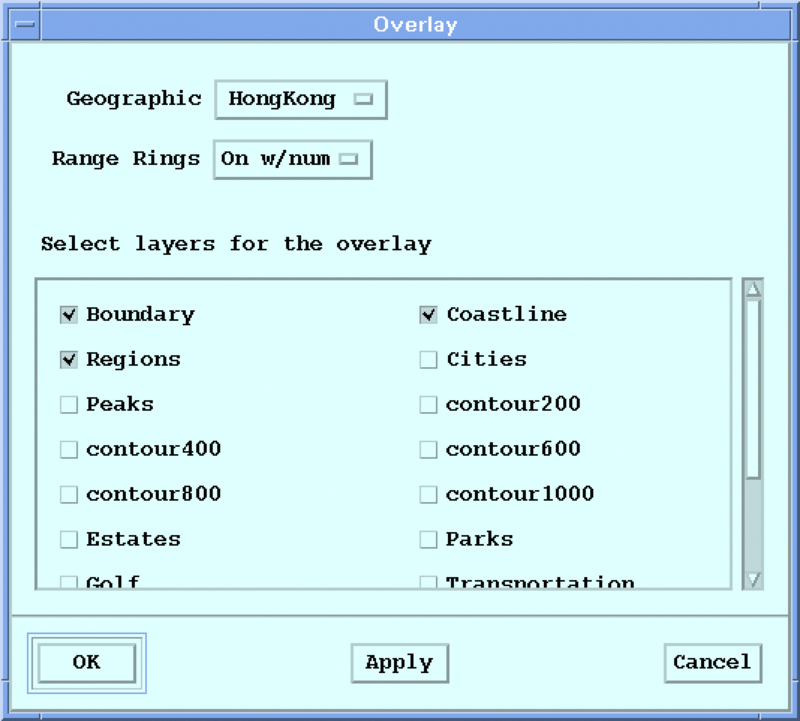
Select Geographic to select from a list of available overlays, or Off.
Select Range Rings to select among:
- Off
- On
- On with numeric labels
- Latitude/Longitude grid (with numeric labels)
 Color Scale
You can modify the colors used to represent the data.
Select the Colors button to open the Color menu. After making a change, the display resets and is painted with the new color scale.
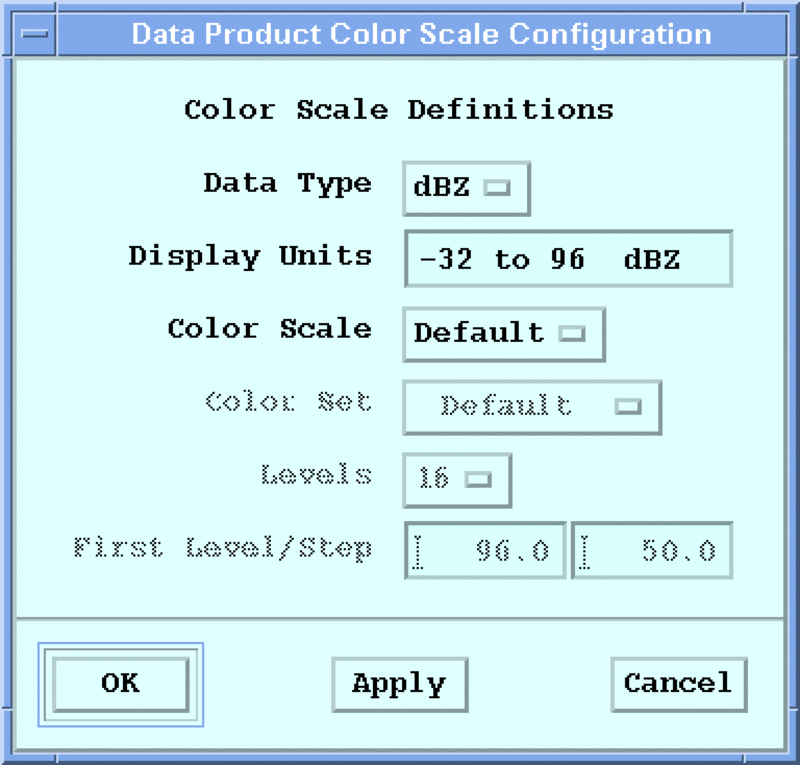
See the Color Scale Tool section in IRIS Product and Display Guide (M212928EN) .
 | Entering a level step of 0 for velocity has the special meaning to display the full unambiguous velocity range. This range is not known until data are received. The velocity color scale show all zeroes in this case until data are received. |