
Histograms
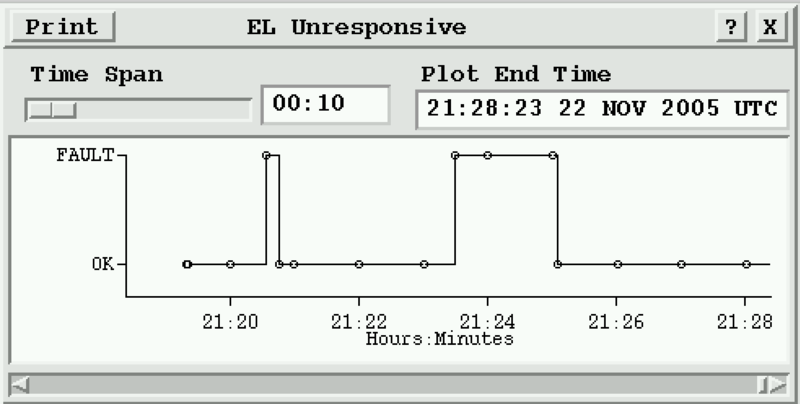
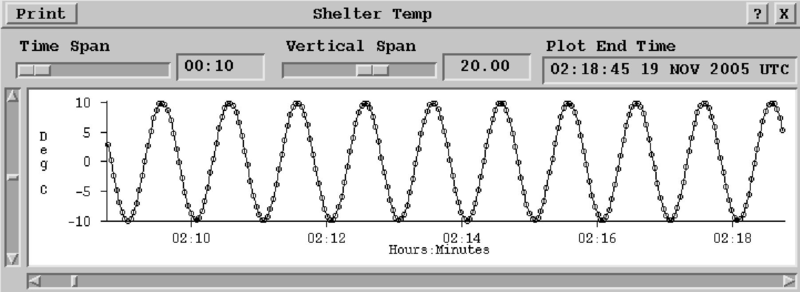
Histograms of the bitex status data may be viewed in a graphical
display format. The output data points can be analog or digital. The histogram may be opened
by right clicking on any of the bitex panels. You cannot pop up the histograms if you started
bitex in -setup mode. The graphical display can be a
valuable tool when assessing the frequency and endurance of faults.
The time scale for viewing the histogram is adjustable from 10 minutes to 96 hours using the Time Span slider. The y-axis scale for analog output is also adjustable with the Vertical Span slider. Each circle represents the time a status packet was received. The graphical display may be printed to a printer or file.
The histogram data files are created in the ${IRIS_LOG} directory. A new log file is generated each day at midnight. An IRIS setup question allows the operator to choose how many days of antenna log files to retain at any given time. Keeping old log files preserved is helpful for post analysis of problems.