
MLHGT: Melting Level Height
The melting level bright band typically represents the location of frozen hydrometeors falling into air warmer than the freezing level, where the particles start to melt.
The height of the melting level is an important aspect to understanding what is happening micro-physically within precipitation systems. Changes of melting level height can assist in determining the likelihood of hail and lightning, and is related to estimating strength of downdrafts due to phase change from ice to liquid. During winter conditions determining the location of liquid versus ice precipitation at the surface is improved with knowledge of the melting level, especially in mountainous terrain.
The presence of the bright band associated with the melting level must be accounted for with quantitative interpretations of weather observations.
In IRIS and RDA software, the SRI product uses the melting level height to perform Vertical Reflectivity Profile corrections, to apply Fall Speed corrections to radial velocity, to distinguish between convective and non-convective precipitation, to account for the different attenuation between liquid and ice, and as a membership function in the Hydrometeor Classification function. Thus an automated determination of the melting level height and how it varies spatially and temporally adds value to the overall weather radar system software.
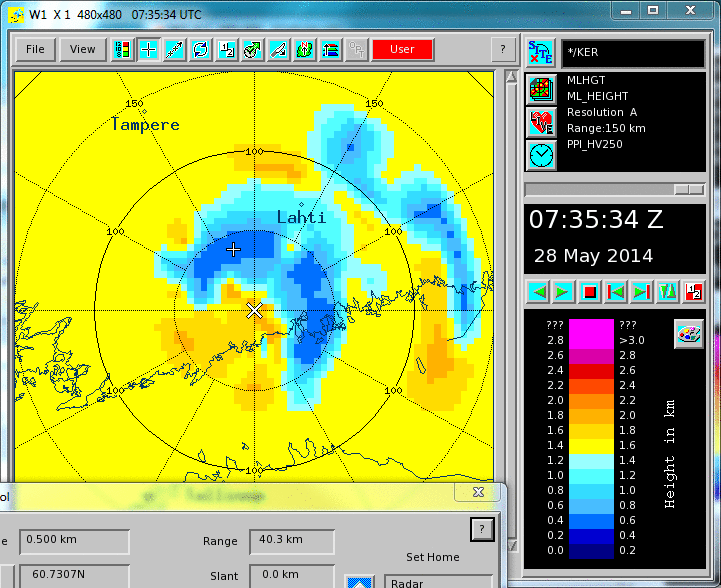
The MLHGT product produced by IRIS is a depiction of the melting level heights on a Cartesian map. The melting level heights are determined on a user defined grid providing an illustration how the melting level heights changes geographically.
Dual Polarization radar data is used as input along with a priori information. As with other IRIS products, the MLHGT product may be animated in time and overlayed with other data to increase situational awareness of the precipitation structure in the atmosphere.