
Recording Data
-
Configure Ascope normally, so that the weather phenomenon is
shown on the screen.
When the Record menu first appears on the screen, Ascope operates the DSP in the usual continuous manner
To create the configuration that you would like to record, you can modify and all menus, including the Record menu.
- Select a maximum range and bin spacing that captures the event at an adequate resolution.
- Setup the PRF, clutter filters, range averaging, spectral averaging, and so on, so that the weather target's characteristics are nicely captured.

You cannot change the Ascope menus during recording. -
Select .
The menu launches in record mode.
-
In the Plot Parameters menu, select the parameters you
want to record.
You can choose up to 16 parameters to be recorded to disk at once. The first 4 parameters are plotted on the screen, and all the selected items are archived.
For example, if you select: Z, T, V, W, I, and Q in that order, Ascope displays the first 4 parameters versus range, and records all 6 as soon as the Rec button is pressed.
If the time step and number of rays were setup for a long interval of recording, you can monitor the plotted parameters by eye and discontinue recording if the weather event changes or becomes less interesting.
The MAG and ARG parameters are not available for recording to disk. This is because these parameters are merely computed at display time and are completely redundant with I and Q. They would not add any averaging or data reduction possibilities if recorded.
If you press the Rec button while a MAG and ARG plot is selected a warning message reminds you that you may not be recording exactly what you think. However, the data file still contains all the other selected parameters.
-
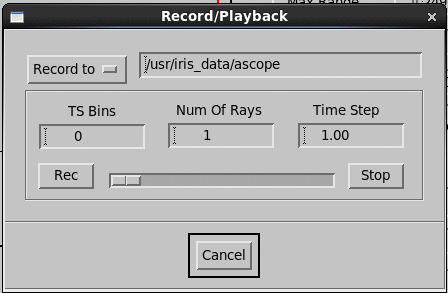
Select the recording directory in which data files are recorded.
The default is /usr/iris_data/ascope. You can change it to any writable directory.
Ascope creates the file names automatically in form WWWYYMMDDHHMMSS.ASC where WWW represents the 3-character local site code, and the remaining characters are the 2-digit year, month, day, hour, minute, and second at the start of recording.
-
Define the number of TS Bins at which time series
and/or power spectra are recorded (0 ... 128).
The chosen bins are centered on the range strobe selected in the Ascope main menu.
-
In Num of Rays, define the number of rays of data to record.
Each ray represents the data from one complete iteration of the basic Ascope loop, that is, one acquisition of the set of all data types that are selected in the Plot Parameters menu.
The maximum number of rays that can be recorded is 10000.
-
Define the Time Step between rays.
This is the time in seconds between successive recorded rays (0 ... 600 seconds (10 minutes)).
Set this value to 0 for a continuous data recording. Use larger values to record over a longer time interval without creating too large a data file.
For example, a time step of 10 seconds would record 6 rays per minute to disk, even though the DSP and display still update continuously.
-
Select Rec.
During the recording session, the progress bar indicates the progress.
Recording stops when the full number of rays are recorded and the slider has reached 100% or when you select Stop.
When recording is complete, the Ascope environment returns to normal operation.
- Select Cancel to return to normal Ascope operation.