

Fuzzy Parameters Optimized for C-Band
The new features imply reprocessing of the algorithm parameters in the new class basis, in a variety of climates, and in the hybrid polarimetric processing mode. Adding these customizations, the understanding of data and phenomena at S-band was extended to C-band.
The existing CSU parameter optimization procedure was applied to multi- season data samples obtained at the Vaisala polarimetric weather radar prototype at University of Helsinki.1
The data samples represented a variety of weather cases (see the following 3 figures) as follows:
- Summer convection
- Winter storm
- Stratiform frontal precipitation
As result, new membership functions and rule strength coefficients were obtained that are used as default settings for C-band weather radars operating in the 'hybrid' mode. The distributions of the membership functions are visualized in the following figures.
For numerical values and more details of the membership function parameters, see Parametrized Fuzzy Parameters.
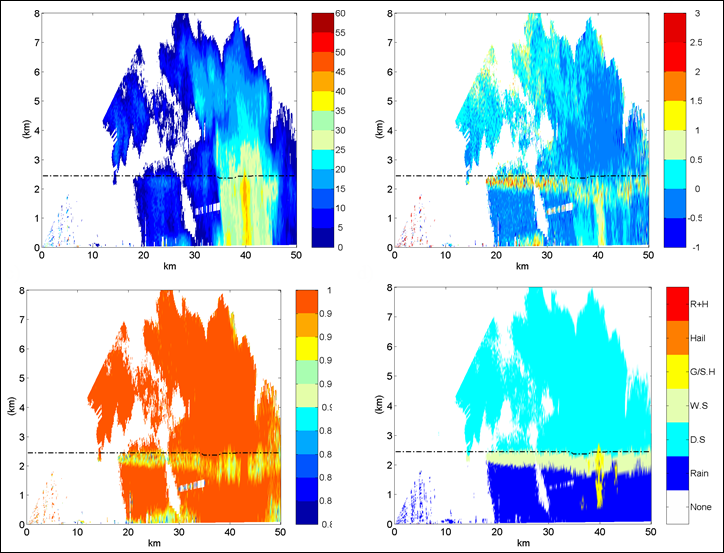
- 1
- Reflectivity Z (dB)
- 2
- Differential reflectivity Zdr (dB)
- 3
- Cross-correlation coefficient RhoHV(0)
- 4
- Classification result ('D.S': dry snow, 'W.S': wet snow, 'G/S.H' graupel, small hail)
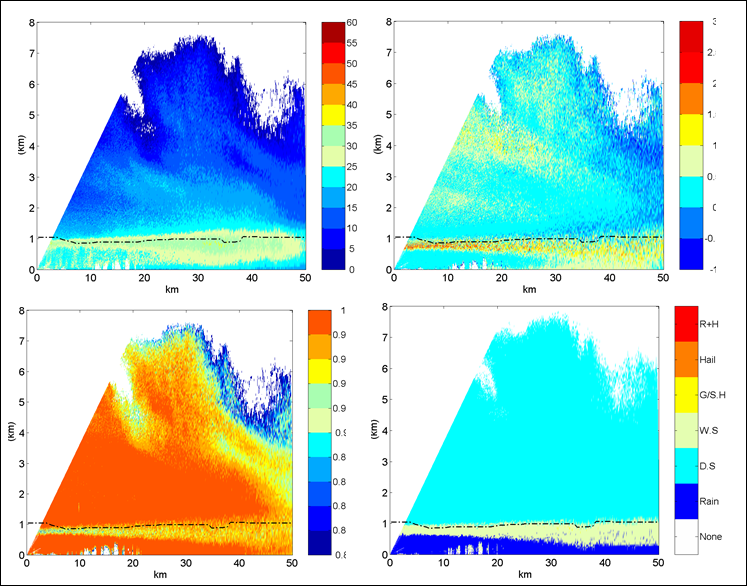
- 1
- Reflectivity Z (dB)
- 2
- Differential reflectivity Zdr (dB)
- 3
- Cross-correlation coefficient RhoHV(0)
- 4
- Classification result ('D.S': dry snow, 'W.S': wet snow)
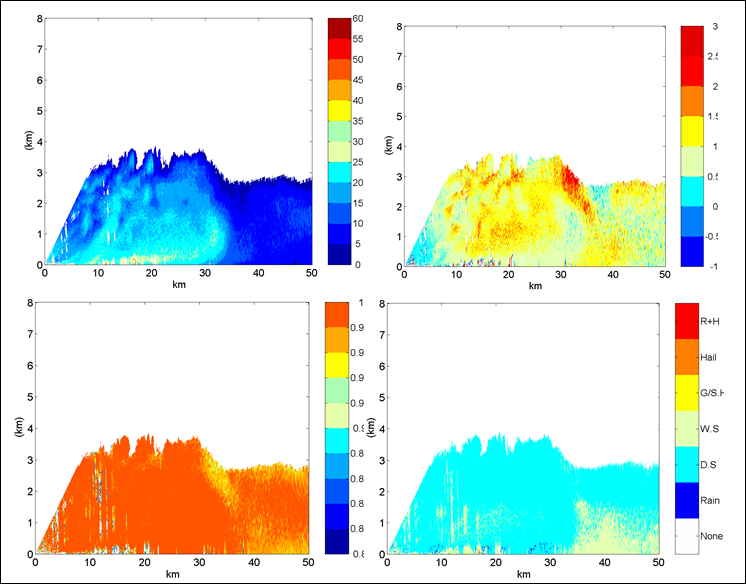
- 1
- Reflectivity ZH (dB)
- 2
- Differential reflectivity Zdr (dB)
- 3
- Cross-correlation coefficient RhoHV(0)
- 4
- Classification result ('D.S': dry snow, 'W.S': wet snow)
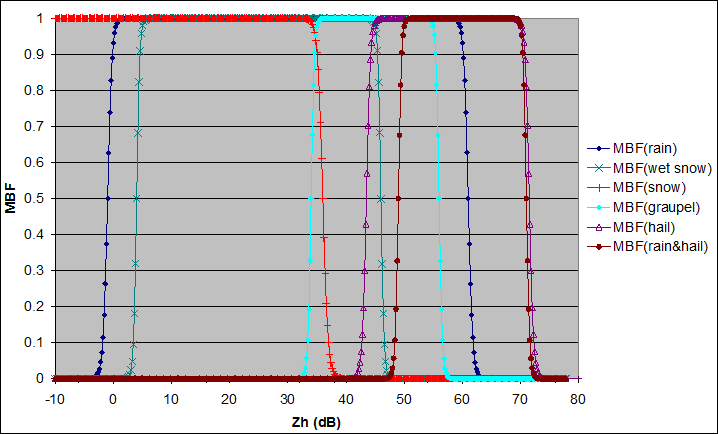
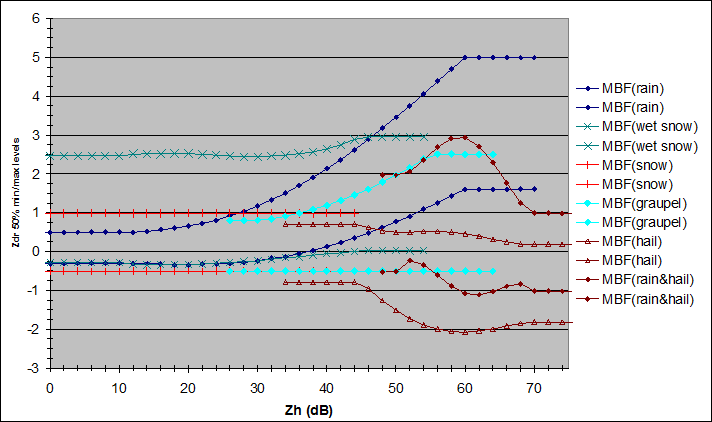
 | Class compatibilities are greater than 0.5 when Zdr values fall between the regions depicted by the contours. |
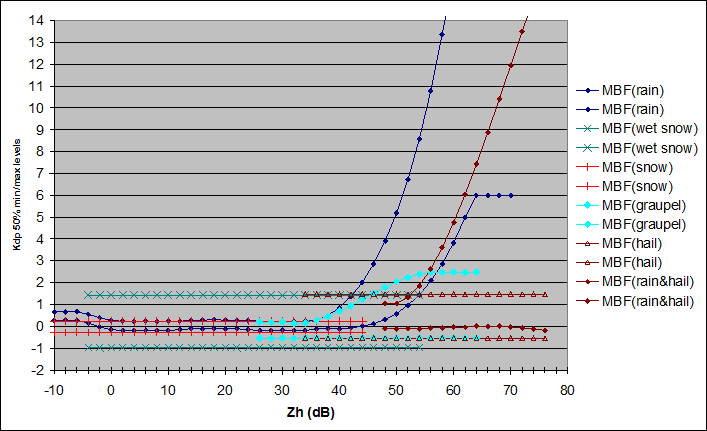
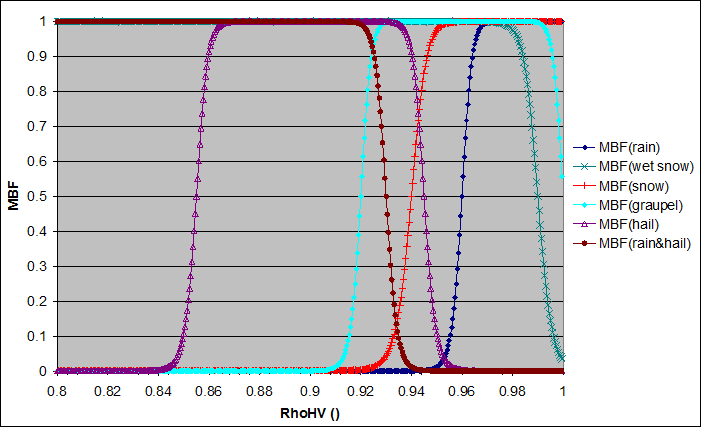
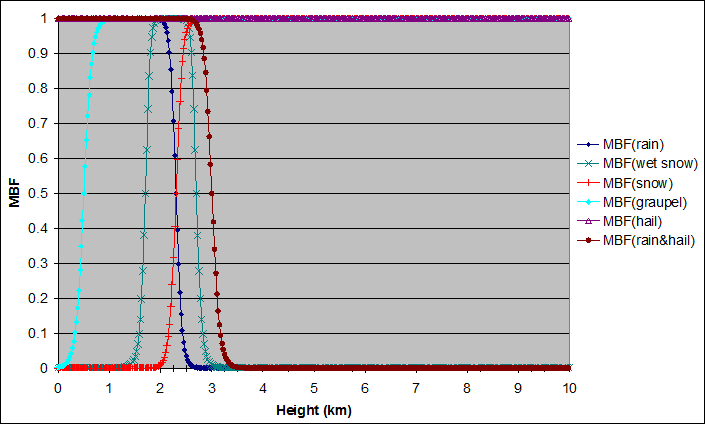
| The contours shift linearly as function of the melting layer height. All heights are expressed with respect to mean sea level. |
The optimized expressions for rule strengths (RS) are analogous to the literature reference with the following new default coefficients:
In these expressions
RSi(ML>0) and RSi(ML<0) refer
to rule strengths of a class i for warm and cold season cases, respectively.
MBFi(x) refers to membership functions of variable
x for the class i.