
Random phase second trip processing algorithm
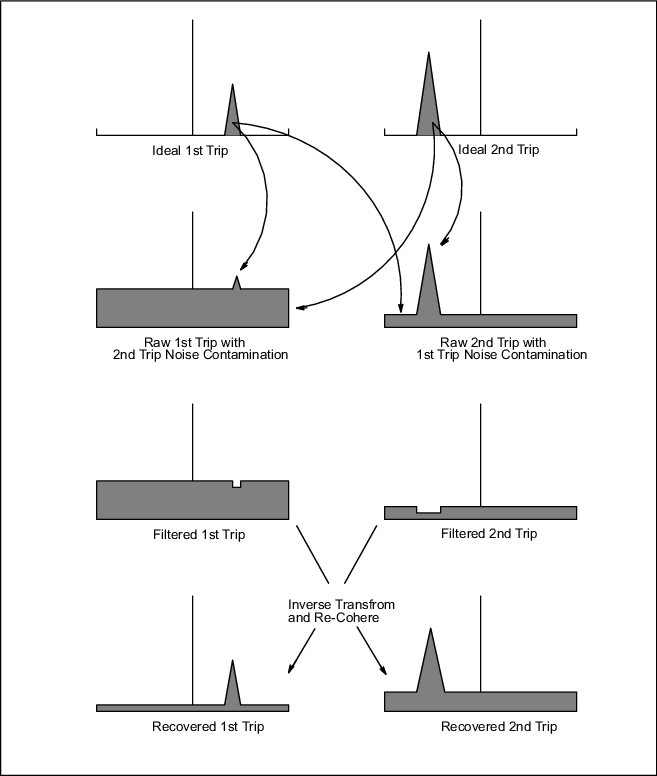
The following figure shows a schematic of the data processing for random phase. The figure shows the Doppler spectra for the first and second trip in the processing stages. The vertical scale is in dB and the horizontal scale is velocity. In this example, the second trip echo is shown as being stronger than the first trip echo (usually the reverse is true).
Ideal 1st and 2nd trip echoes
The ideal 1st and 2nd trip echoes represent the echoes as they would appear individually. The ideal 1st trip echo is the echo that would be measured if there was no second trip echo interference. The ideal second trip echo represents what would be measured if there was no 1st trip echo interference. If there is no interference from the other trip, a standard Klystron system can measure the ideal spectra, but there is no way to know whether the echoes are in the first or second trip.
Raw 1st and 2nd trip echoes
The figure Random phase processing algorithm above shows how the echoes from the first trip and second trip interfere with each other. For the case of a standard magnetron system, the first trip echo is coherent, while the second trip echo is incoherent (white noise) since the phase of the second trip echo is random. This is because the receiver is phase locked only to the first trip.
Another way to implement a magnetron system is to let the Stalo free-run (rather than phase locking to the transmit pulse), measure the phase of each transmit pulse and digitally correcting for the transmit phase. Using this digital phase locking technique, the RVP10 can phase lock or "cohere" to either the first or the second trip.
Using this technique alone, it is possible to distinguish between 1st and 2nd trip echoes for the case when the echoes are not overlapped. The echoes appear as the idealized first and second trip echoes. This range de-aliasing effectively doubles the range of the radar. The problem is that when echoes are overlapped, the noise contamination from the stronger echo make it impossible to measure the weaker echo. This is illustrated in the figure. Thus if the first trip echo has a good signal-to-noise ratio of 10 dB, then the 2nd trip echo has a signal-to noise-ratio no better than -10 dB. This is the fundamental problem with using phase alone to separate the 1st and 2nd trip echoes.
Filtered 1st and 2nd trip echoes
Since the strong echo generates noise that obscures the weaker echo, the approach used in RVP10 is to filter the echo from the other trip — the whitening filter. This is shown in the figure. The adaptive whitening filter removes both the clutter and the weather. All of the phase information for the other trip is then contained in the white noise portion of the spectrum. The phase information under the coherent echo that is removed is dominated by the coherent echo, that is, the other trip phase information is contaminated. For this reason, the filtering should affect as small a region of the spectrum as possible.