
Time series and Doppler power spectrum example
The following figure shows the components of the Doppler spectrum, that is, white noise, weather signal, and ground clutter. Other target types such as sea clutter, birds, insects, aircraft, surface traffic, second trip echo, and so on may also be present.
- The top part shows the I and Q values for a simulated time series using the Ascope utility.
- The bottom part shows an example of a Doppler power spectrum for the time series shown in the upper part of the figure.
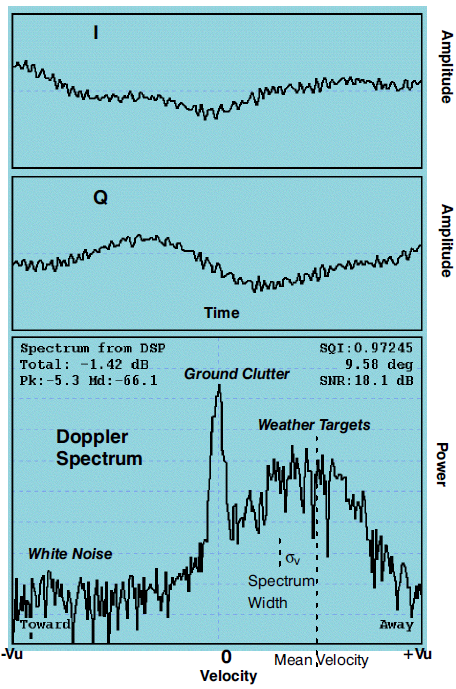
The image shows a time series of I and Q and the corresponding Doppler power spectrum obtained from the Ascope utility using the built-in simulator. The Doppler spectrum displays the radial velocity on the X-axis over the unambiguous range (Nyquist interval) and the power (in dB) relative to the saturation of the Y-axis. For the sake of illustration, this example is based on 256 time series points (one point per pulse) which yields 256 spectrum components. This is more than is usually processed in actual operation.
- white noise
- ground clutter at zero radial velocity
- a spectrum of the weather targets having a Gaussian shape characterized by the weather power, mean velocity, and width (standard deviation), that is, the spectrum moments.