
Display Status
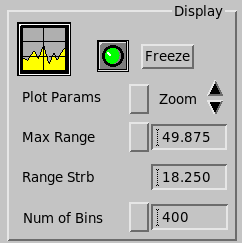
- Freeze/Resume
- Freezes or unfreezes the display, and stops or starts the signal processor. The green light indicates that the display is not frozen and the signal processor is running; the red light indicates that the display is frozen and the signal processor is not running.
- Plot Parameters
-
Shows the currently selected plot parameters. Select the button to launch the Plot Parameters menu, where you can select from one to four plots displayed in the order you choose.
You can set up to 8 parameters can be selected at once . The first 4 are plotted on the display. See Data Recording and Playback.
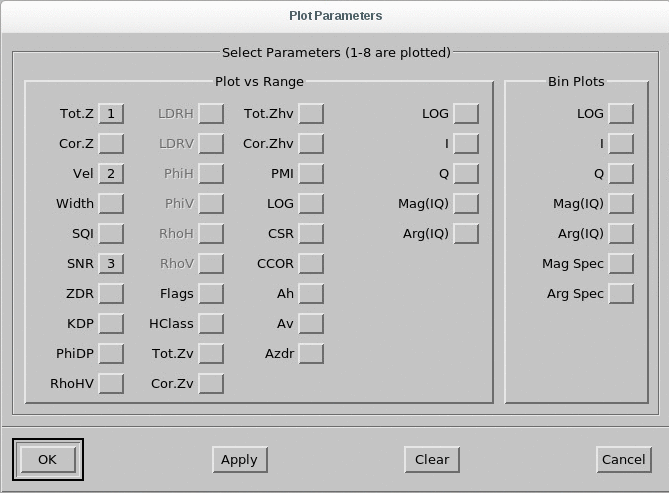
Choose the plot parameters you want to display.
If you specify fewer than 4, the specified plots are displayed.
If you specify more than 4, only the first four are displayed.
If you select Clear, no parameters are selected and Ascope displays one plot: the reflectivity against range plot.
- Max Range
- Shows the maximum range plotted for the selected plot parameters. You can also specify a new maximum range by entering any number or choosing from a menu. If the specified Max Range exceeds the unambiguous range, then the unambiguous range is substituted. The maximum range is constrained to be an integer multiple of the signal processor resolution multiplied by the number of range bins.
- Range Strobe
- Shows the value of the selected range for the spectrum and time series plots, as well as the range for the numerical values displayed in the parameter against range plots. This range is also used for noise samples. The Range Strobe is displayed in the plots as a vertical red line. You can change the value of the Range Strobe field and the position of this line in a number of ways:
- Number of Bins
-
Shows the number of range bins being plotted. Select the button to select the number of acquired bins.
The maximum value that this field can have depends on the signal processor.
The number of bins determines the number of points plotted on the parameter against range plots, including the Z, T, V, W, AI, AQ, and ALOG plot parameters.
Reducing this value can increase the update rate because less data needs to be transferred. This is useful when more rapid updates are required, especially for serial line graphics displays.