
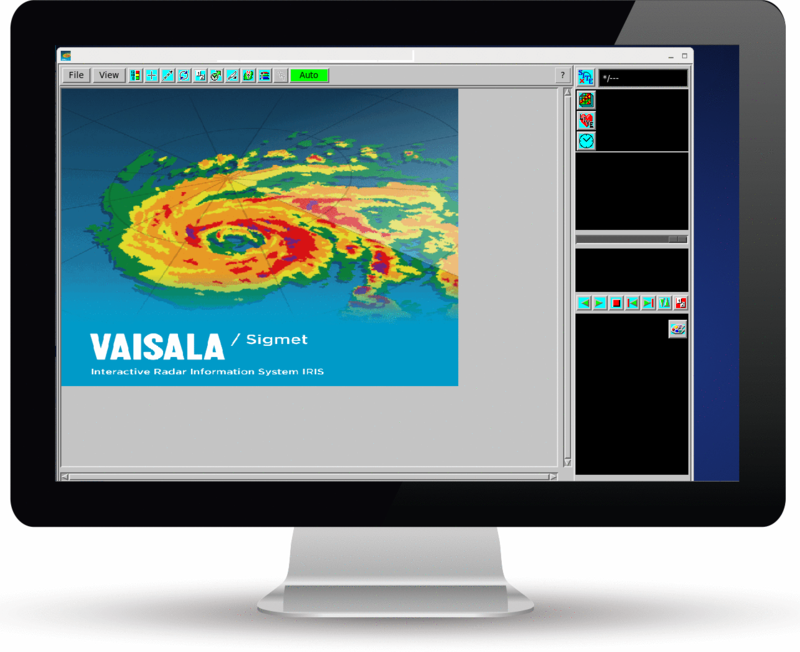
Processing Status
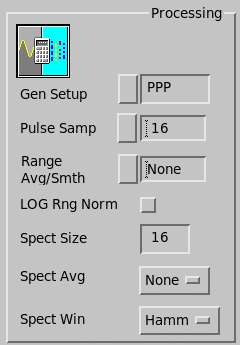
- General Setup
- Shows a menu displaying the current processing mode and options. You can use
this menu to switch between major modes of the RVP (such as PPP and FFT), and to select
other processing options.
-
R2 Algorithms button
Selects whether the computation for spectral width uses three correlation lags (R0, R1, and R2), or only 2 (R0, and R1).
-
Clutter Microsuppression button
Enables the algorithm for removing suspected clutter bins from a run of range averaged samples.
-
16-Bit Time Series button
Instructs ascope to read extended precision samples during the time series modes. It should generally be pressed ON. The OFF position causes 8-bit fixed point data to be read.
-
Spectra from DSP button
Causes the Ascope spectrum plot to be drawn from spectral components that are read directly from the DSP, rather than internally computing those components from the raw time series.
The DSP spectra are often interesting during major modes that employ spectral filtering (such as the FFT and Random Phase modes).
-
Type of Spectra button
Is sensitized only in Random Phase major mode and only if spectra are being read directly from the DSP. This button pops up a menu of 8 power spectra and lets you view the data as they progress through the RVP processing stages.
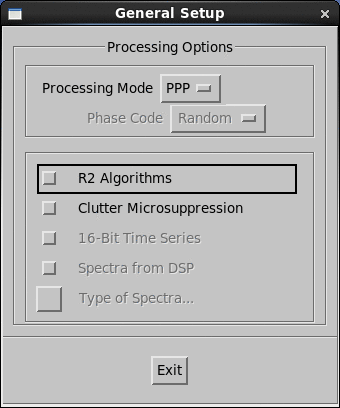
The buttons in this menu are "live" and take effect immediately. You may keep the menu up on the screen to compare the results with different settings.
Select Exit when you are finished. The Major Mode remains visible in the button on the main screen.
-
- Pulse Samples
- Shows the current number of pulses for averaging of the spectrum moments or for time series. You can also select the number of samples (pulses) to be averaged into each of the V, W, Z or T plots; or the number of I, Q or L time series points to be plotted. The valid range is from 4 to 256. This field also sets the Spectrum Size field.
- Range Average or Smoothing
- Sets the number of consecutive range bins to average within the DSP before displays. Choose None for no range averaging. Smoothing performs an average in range, but does not reduce the number of recorded range bins. An entry such as 1/4 means no range averaging, but do range smoothing over 4 bins.
- LOG Range Normalization
- Toggles range normalization of the LOG channel on and off. In some cases, you may want to disable the LOG channel range normalization algorithm in the signal processor. In this case, the reflectivity against range plot displays dBm above threshold rather than radar reflectivity factor.
- Spectrum Size
- Shows the number of samples used for a Doppler spectrum. This is always the greatest power of two less than or equal to the Pulse Samples field. That is, the Spectrum Size is the value of Pulse Samples field rounded down to the nearest of 4, 8, 16, 32, 64, 128 or 256.
- Spectrum Average
- Shows the averaging constant for spectrum averaging. The time constant for spectrum averaging affects only the spectrum display (the Spec plot parameter). The argument None corresponds to no averaging. The number 8 corresponds to maximum averaging. This number is the time constant of an exponential average in CPIs. Thus, a value of 1 means that after spectrum is computed, the previous data has weight 1/e. You should allow ample time for the spectrum to settle after changing the averaging. Changing the spectrum size zeroes the averaging. The annotation numbers displayed in the spectrum plot are also averaged.
- Spectrum Window
-
Select the window to be applied to the time series before the spectrum is computed. The window dramatically affects the spectrum and can affect the computed SQI shown on the plot.
The choices are: Black (Blackman), Hamm (Hamming), and Rect (Rectangular).