
Doppler Mean Velocity Against Range Plot (V)
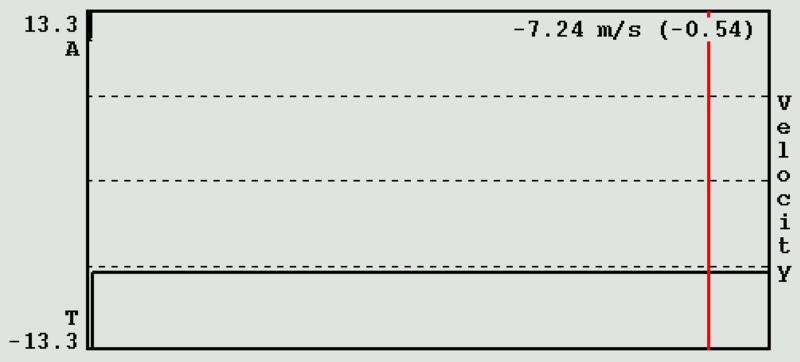
This plot is generated when you choose the V plot parameter.
The mean velocity corresponds closely to the peak velocity in the Doppler spectrum display. Velocity is displayed in m/s on the unambiguous velocity interval. T indicates toward, and A indicates away.
Similar to the reflectivity plots, the value of the mean velocity in m/s (and normalized to the interval [-1, +1]) at the selected range is displayed in the upper right corner of the plot.
See also the Pulse Samples, Threshold Levels, Doppler and LOG Filter, Thresholds, and Number of Bins fields.