
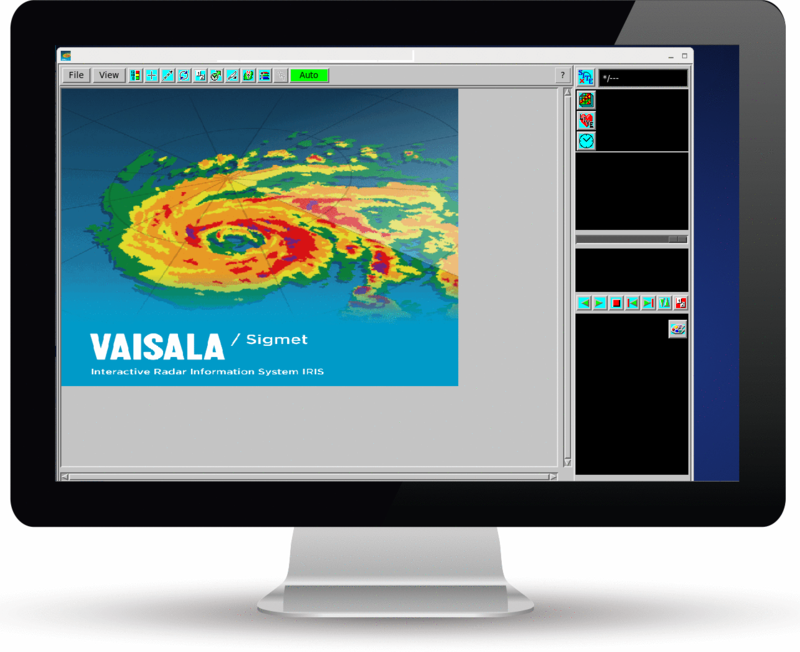
Reflectivity Against Range Plot (T and Z)
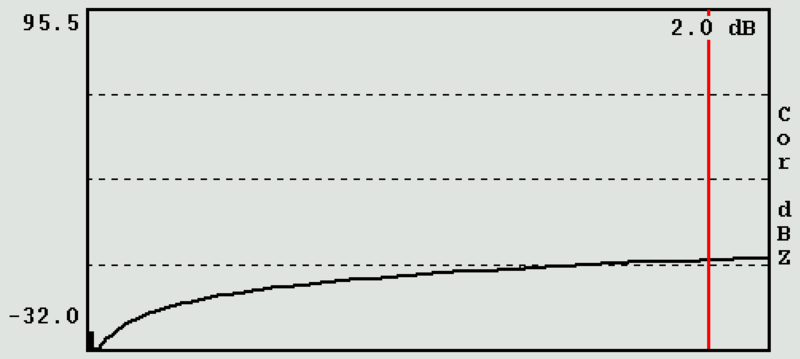
This plot is generated when you choose the T and Z plot parameters.
T is the total reflectivity without clutter correction; Z is the reflectivity with clutter correction. These are the equivalent radar reflectivity factors and are fully calibrated estimates.
You must calibrate your radar system before the values are correct. See Zauto Overview and RVP10 User Guide (M212604EN).
The Ascope utility lets you temporarily change the slope and offset of the calibration without modifying the calibration file used for the IRIS system.
The data are plotted in -32 ... 96 dBZ decibel values between 0 and the selected Max Range. The numerical value in the upper right of the plot shows the reflectivity at the selected range, indicated by the vertical red line.
See also the Pulse Samples, LOG Filter, Thresholds, Number of Bins, LOG Range Norm, Calibration ZCAL, and Calibration Slope fields.