
Spectrum Width Against Range Plot (W)
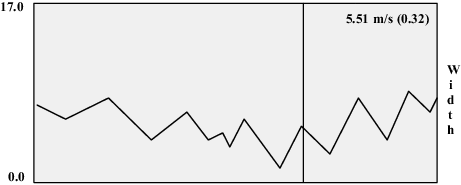
This plot is generated when you choose the W plot parameter. The spectrum width is the standard deviation of the Doppler spectrum. (The Doppler spectrum display itself always appears broader than the indicated width, because the spectrum is on a log scale).
Width is displayed in m/s up to the unambiguous velocity value. Broader widths are difficult to measure.
Similar to the mean velocity, the numerical value of the width is displayed in m/s and for the normalized velocity interval [-1, +1] for the selected range (as indicated by vertical yellow line).
See also the Pulse Samples, Threshold Levels, Doppler and LOG Filter, Thresholds, and Number of Bins fields.