
Burst timing plot display
The following figure shows an example of a burst timing plot display.
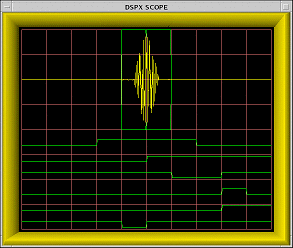
X and Y axis: time and amplitude
The vertical axis indicates the frequency amplitude.
The horizontal axis idicates time. The duration can be adjusted using the T/t keys to increase or decrease the timespan of the plot.
Pulse signal
In the graphical interface, the burst pulse signal is shown as a yellow line. The signal is shown in (nearly) real-time, constantly changing according to the transmitted pulses. If no pulse is shown (just a flat line), it means that either the transmitter is off or the trigger has not been properly configured.
The same FIR coefficients that compute I and Q are used to compute the reference phase vectors for the burst pulses.
Sampling window
The upper portion of the display shows the sampling window where the burst pulse is measured.
The outer green window in the middle of the screen is the Impulse response length window (sampling window). The pulse should occur at the center of this window. If not, you need to adjust the triggers until the pulse is at the center of the window. The sampling window is always in the middle of the display.RVP10 computes the power-weighted center-of-mass (COM) of the burst pulse envelope. This allows the processor to determine the location of the "middle" of the transmitted pulse within the burst analysis window.
The display has small tick marks on the top and bottom of the burst sample window to indicate the location of the COM. These markers are only displayed when valid burst power is detected. A square surrounding the tick mark indicates the level of uncertainty of the mark. This error interval is used by the burst pulse tracking algorithm to decide when a timing change can be made with confidence.
AFC window
The inner green window is the AFC window. It should be at the middle of the pulse, so that the raising and falling edges of the pulse are excluded. The AFC window is essential for magnetron radar systems.
You can independently choose a sub-interval of burst pulse samples that are used by the AFC frequency estimator.
The AFC feedback loop is not constrained to use the same set of samples that are chosen for the FIR filter window. The FIR window typically is longer than the transmitted pulse, and thus, the samples contributing to the frequency estimate includes the leading and trailing edges of the pulse. These edges tend to have severe chirps and sidebands, compared to the more pure center portion of the pulse.
The AFC frequency estimate (which is power-weighted) may be misled by these edges and may not tune to the optimum center frequency if they were included.
Triggers
The lower portion of the plot shows the
triggers created by RVP10. The triggers are shown as green lines. The number of triggers is
set in the Mt menu (number of user-defined output triggers).
Trigger #1 is at the top. The triggers are drawn in their correct
polarity and timing relative to each other, and relative to the burst sample window.
In the graphical interface, you can move all the triggers together. You can also do this on the command line with the Pb commands. On the command line, you can also move individual triggers. To do this, go to the individual trigger settings.
Time zero is indicated in the window. RVP10
defines Range Zero to occur at the center of the burst sample window. This
also defines the zero reference point for the starting times of the six programmable
triggers. For example, a trigger whose starting time is zero is plotted with its leading
edge in the exact horizontal center of the display.