
Processor configuration
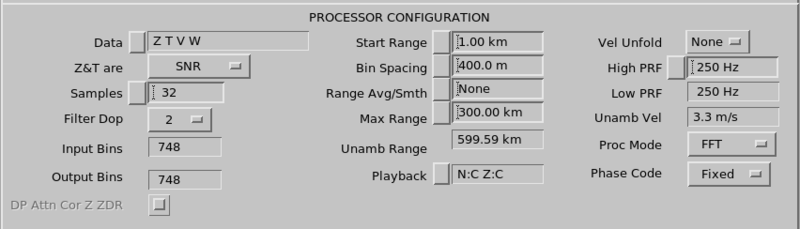
Use the pane to set up output data, ranges, and averaging used by the signal processor.
Data
Select Data to define the types of data output sent by the signal processor and stored in the ingest files.
Data shows data appropriate for you system. You can only select data types appropriate for you task’s configuration. You can also select whether to record in 8-bit or 16-bit format.
The number of parameters you select affects the size of your Ingest and Raw product files.
When you exit the menu, your choices are displayed in the field.
See RVP10 User Guide (M212604EN).
| Data type | Description |
|---|---|
|
|
Integral attenuation for horizontal (H) and vertical (V) channels |
|
|
Integral attenuation of ZDR (dB) format |
|
|
Doppler channel clutter-to-signal (CSR) ratio of dBT to -dBZ |
|
|
Total power |
|
|
Clutter corrected reflectivity |
|
|
Uncorrected reflectivity |
|
|
Hydrometeor classification Estimated hydrometeor type in the precipitation area |
|
|
Specific differential phase An indicator of the rate of change of the phase difference between horizontally and vertically polarized pulses of the radar. A greater horizontal shift results in a positive KDP value, and a greater vertical shift results in a negative KDP value. Typical cause for a high KDP area is heavy rain. |
|
|
Linear depolarization ratio H to V (or V to H) The ratio of cross-polar to co-polar reflectivity measured in dB |
|
|
Log receiver signal-to-noise ratio |
|
|
Horizontal (V) or vertical (V) differential phase Phase difference for the total round
trip between radar and the volume where the signal is reflected.
|
|
|
Differential phase The phase difference due to propagation between the HH and VV channels of the radar. |
|
|
Polarimetric meteo index |
|
|
Rate of accumulation of precipitation in units of mm/hour For snow, this is usually refers to the liquid equivalent. |
|
|
Correlation coefficient between HH and VV (or HH & HV / VV & VH) channels Higher (>0.95) values indicate uniform precipitation areas, and lower values indicate more mixed hydrometeor types, such as melting snow, wet snowflakes, or airborne debris. |
|
|
Signal-to-noise ratio Generic measurement of signal-noise ratio in dB |
|
|
Signal quality index A value between 0-1 that measures
the signal's Doppler coherency, that is, the correlation between the signal and its
Doppler lag:
|
|
|
Total reflectivity Total power returned to the radar in reflectivity units. It typically represents the horizontal reflectivity without ground clutter correction. |
|
|
Total vertical (HV enhanced) reflectivity Total reflectivity from the vertical polarization channel (TV) and combination of the horizontal and vertical channel (TE) |
|
|
Velocity Average radial velocity (towards or away from the radar) of detected hydrometeor areas |
|
|
Corrected velocity Same as velocity |
|
|
Velocity and corrected velocity of wind shear |
|
|
Spectral width Variability of Doppler velocity values within the measurement area |
|
|
Polar cross-correlation, uncorrected
Because this value is not noise corrected, this is a direct indicator of the PHIDP uncertainty. |
|
|
Reflectivity Usually referred to as dBZ, this is the common data type that measures radar signal reflectivity, and is used to estimate precipitation intensity from that. All |
|
|
Vertical (HV enhanced) reflectivity Total reflectivity from the vertical polarization channel ( |
|
|
Corrected reflectivity Same as reflectivity
|
|
|
Differential reflectivity The ratio of SNR in the horizontal channel to the SNR in the vertical channel. Positive values indicate more prominent horizontal echoes and negative values more prominent vertical echoes. Larger hydrometeor sizes are usually identified by high positive ZDR values. |
|
|
Corrected differential reflectivity Same as differential reflectivity
|
T&Z are
Choose how T and
Z are handled:
-
Calibrated radar reflectivity factors
Most common configuration.
-
Measured signal-to-noise ratio (SNR)
Used for diagnostic and troubleshooting purposes and for radar antennas with non-standard beam patterns. Note that when SNR units are selected, the clutter correction is applied to
Zbut not toT.
Samples
Specify how many pulses are averaged (from 2 ... 256, continuously selectable) to obtain the final estimates of the radar parameters for each ray in Samples.
IRIS requires approximately 40 samples for acceptable averages and reliable clutter cancellation.
In general, the number of samples should be as large as possible, however, the more samples there are, the slower the antenna scan speed must be.
Filter Dop
Use the Filter Dop to specify a clutter filter type.Selecting a clutter filter depends on the scan rate, antenna beam width and the operational objectives. In general, the narrower the filter the better, since a broad clutter filter has a greater adverse effect on the weather echoes. The narrower filter is also less aggressive.
Most users must experiment with the best combination of clutter filters and thresholds. See Optimizing Thresholds.
To determine which
filters best reduce the effects of clutter while doing the least damage to the weather, try
different clutter filters on a rainy day and compare Z and
T (the corrected and uncorrected reflectivity) on the real time
display.
 | When optimizing the Doppler
filter, do not use the CSR threshold as the Z threshold criterion. |
To determine the appropriate filter, use the Ascope utility to measure the actual width of clutter Doppler spectra as a function of the scan rate, which can be controlled through the Antenna utility). For more information, see IRIS and RDA Utilities Guide (M211316EN).
For more information on configuring clutter filters, see RVP10 User Guide (M212604EN).
Start Range
Start Range specifies the required range of the first data bin to the nearest 1/10 km.
Usually this is set to 0.0 so that sampling starts at the closest possible range. However, when 2 tasks are used to define a sampled volume, it is sometimes useful to have:
- One task sample an inner range at a high PRF.
- One task sample an outer range at a low PRF.
Bin Spacing
Bin Spacing specifies the desired range resolution of the data.
Type the value to the nearest meter or choose from a list of values.
IRIS picks and displays the allowable bin spacing that is closest to your choice. This depends on the processor, with a typical value of 125 meters.
See IRIS and RDA Utilities Guide (M211316EN) and TTY Non-Volatile Setups in RVP10 User Guide (M212604EN).
Range averaging, input bins, and output bins
Range averaging means that the data obtained at the output bins is obtained by averaging 2 ... 16 input bins.
| Choice | Description |
|---|---|
| None |
No range averaging. The Input Bins and Output Bins fields are identical. No range averaging is performed, and single-point sampling is done for each of the output bins. |
| 2 ... 5 |
Range averaging over 2 ... 5 bins. For example:
The total number of input bins is limited by the processor. If you specify a range average that results in greater than the processor limits, IRIS reduces the maximum range to be consistent with the limit. |
Max Range
Max Range defines the maximum range (km) of data collection.
If fields such as the PRF, Range Averaging, or Bin Spacing change, IRIS attempts to fill in range bins to the full unambiguous range. If this is successful, Max Range equals the unambiguous range.
In most cases, Vaisala recommends keeping the Max Range less than Unambiguous Range.
Max Range turns red if it exceeds the Unambiguous Range. A Max Range that exceeds the unambiguous range is allowed for users using their own major processing mode. It is also useful to allow the Max Range to exceed the unambiguous range by 1 range bin to make the Max Range an even value, for example 150 km instead of 149.9 km. In other cases data that exceeds the unambiguous range is nulled.
When using the dual-PRF technique, if a user requests a maximum range greater than the Rmax of the High PRF, but less than the Rmax of the Low PRF, the range field turns yellow. This indicates that the 2D 3x3 speckle filter will be used to interpolate across the radial boundaries. If a user inserts a maximum range greater than the Rmax of the Low PRF, the field turns red, indicating that the requested max range is exceeded.
Unambiguous Range
The display-only Unambiguous Range is the maximum range for first trip echoes — the maximum range from which an echo can be received before the next pulse is issued. It is affected if the PRF is changed.
Playback
Playback determines the noise floor and calibration level used by the RVP when playing recorded time series data. The options are:
- RVP current noise floor and calibration level
- Values recorded in the time series
The Playback value has no effect on the noise floor and calibration level of the RVP during normal operation.
Vel Unfold
For Doppler systems, velocity unfolding (Vel Unfold) determines whether dual PRF control and processing are performed.
For more information, see RVP10 User Guide (M212604EN) .
| Choice | Description |
|---|---|
| None |
Single PRF operation with no velocity unfolding. |
| 3:2 |
Dual PRF with ratio of 3:2. This provides 2X velocity unfolding as compared to the unambiguous velocity for the larger PRF. |
| 4:3 |
Dual PRF with ratio of 4:3. This provides 3X velocity unfolding as compared to the unambiguous velocity for the larger PRF. |
| 5:4 |
Dual PRF with ratio of 5:4. This provides 4X velocity unfolding as compared to the unambiguous velocity for the larger PRF. |
High PRF and Low PRF
Specify High PRF and Low PRF by entering a value to the nearest whole Hz, or by choosing from a list of values.
The computed Low PRF is displayed in the adjacent column (display only).
The maximum and minimum values depend on the duty cycle limit of the transmitter for the selected pulse width. If you enter a PRF that exceeds of these limits, IRIS inserts the limited value.
Unambiguous Velocity
The display-only unambiguous velocity (Unamb Vel) changes when you change High PRF or Velocity Unfold.
Processor Mode
Proc Mode determines the processor mode.
| Mode | Description |
|---|---|
| PPP | Pulse pair processing. |
| FFT | Fast Fourier transform. |
| RPHASE | Random phase. |
| DPRT–1 | Dual PRT mode 1. |
| DPRT–2 | Dual PRT mode 2. |
| BATCH | Batch Mode Processing. |
| Phase Code |
Phase Code
The transmission phase of a Magnetron transmitter is always Random.
For Klystron and TWT amplifier transmitters, the transmission phase may be controlled using a phase shifter. This field allows the signal processor to specify the phase of each pulse.
-
Fixed is the legacy mode for Klystron and TWT amplifier transmitters.
-
Random allows a Klystron or TWT amplifier to mimic the pulse phase of a Magnetron, which is useful for second trip echo cancellation.
-
SZ 8/64 is a predetermined phase code algorithm which mitigates range ambiguities and allows for better recovery of weak first trip spectral moment estimates that have been contaminated by stronger second trip estimates.
Attenuation Correction
To enable attenuation correction for dual polarization, select DP Attn Cor Z ZDR.
| You need a valid dual-polarization license code to use the dual-polarization attenuation correction function. See RVP10 User Guide (M212604EN). |