
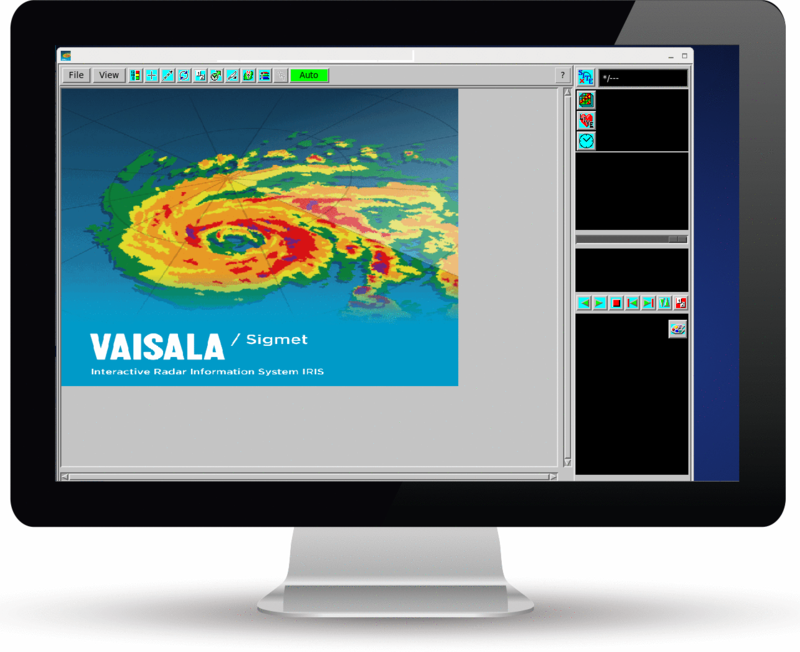
Zauto calibration plot
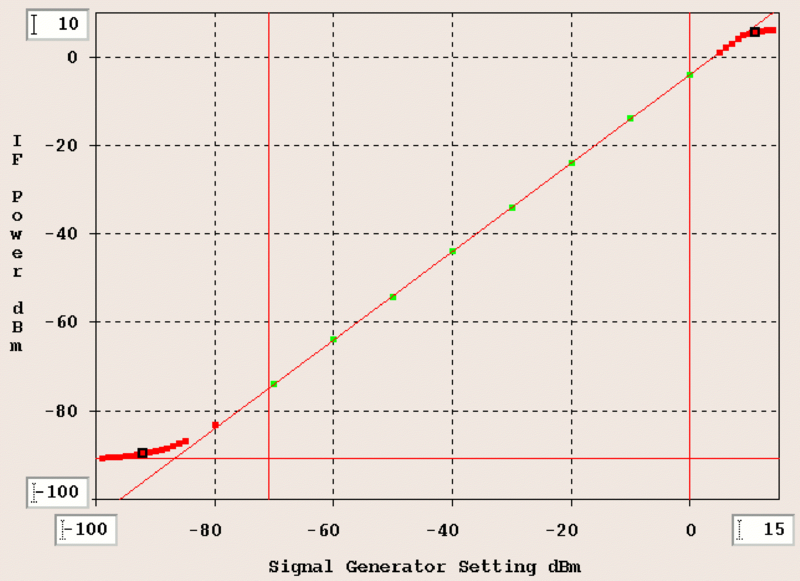
Zauto displays a plot of the IF power in dBm against the signal generator setting, similar to the plot shown in the reflectivity calibration section of RVP10 User Guide (M212604EN).
Here, the horizontal axis of the plot is the input signal power at the antenna, which accounts for antenna-to-receiver loss and signal generator loss.
Zauto corrects for these effects, based on the setup information. In performing the calibration, it displays the signal generator value on the horizontal axis.
- Left and Right Plot Limits
-
Plot range fields at the lower left and right of the calibration plot define the lower and upper limits, in dB, of the signals to be generated.
You can change the limits, and Zauto rescales the plot for the new range.
Zauto does not allow a new range limit when there would be data points outside the range.
- Left and Right Fit Limits
- Vertical red lines mark the limits of the least squares fit. They can be moved independently by pointing with the mouse on the graph and clicking the left mouse button.
- Plot Points
- Plot points are the dots that mark the strength of the signal sampled at a number of specified settings. A black box is drawn about the low and high point used to calculate the dynamic range.
- Fit Line
- Shows the least squares fit of the plot points that fall within the fit limits.
- Noise Level Line
- The noise level line is a horizontal line drawn when the siggen is not generating a signal.