

Displaying GAGE
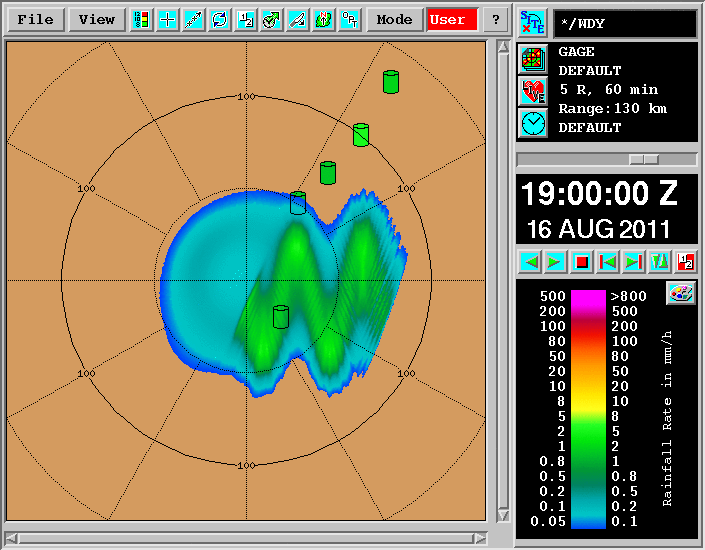
You can display GAGE products in the Quick Look Window, as well as in other display outputs.
GAGE products are displayed in the form of a situation display showing a graphic of a rain gage can at the location of each gage.
Each gage is colored with the color for the rainfall accumulation measured by the gage. See the previous figure for an example of this display with radar data underneath.
The product-specific output option for gage products allows you to specify if the gage label is shown next to each gage.
- In the Quick Look Window, display a GAGE product.
-
Place the cursor in the display window and right-click the mouse.
IRIS checks for the nearest rain gage location, and shows a rain gage datagram with 12 hours of history.
The following example shows the hourly rainfall accumulation for the last 12 hours.
Figure 2. Raingage Datagram 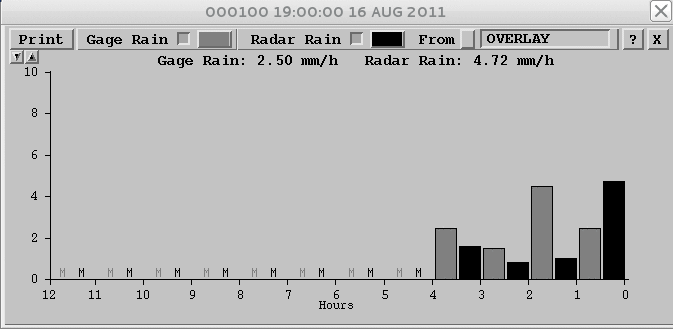
You can configure the graph show just the rain accumulations from the rain gage, or radar rain accumulations from RAIN1 products, or both.
-
If you are displaying radar rain accumulations, select which named
RAIN1 product to display from.
The selected RAIN1 product becomes the default RAIN1 used as the topmost overlaid product. If there is no overlaid RAIN1, then its default is off.
If you change the default RAIN1, future datagrams use the new product, until all datagrams are dismissed.
You can show up to 10 rain gage datagrams simultaneously. This allows you to compare different gages, or RAIN1 products.