
Display Parameters
The display parameters determine how the product appears.
Display Units
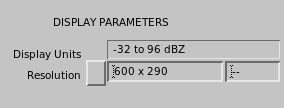
Most data types are numerical. Display Units shows the range of values and the units for the product's output values.
For example, the Echo Tops algorithm outputs values in km to the nearest 100 m (328 ft 1 in) spanning the range of 0 to the maximum data height defined with the setup utility or 25.5 km (15.8 mi), whichever is less.
| Display Parameter | Maximum Display Range, Display Units, or the Classifier method |
|---|---|
| dBZ | -32 ... 96 dB mm6/m3 |
| dBZt | -32 ... 96 dB mm2/m3 |
| Rain | 0 ... 255 mm/hr or 0 to 10.2 inches/hr |
| Liq | 0 ... 1000 mm |
| Vel | -Vu to
Vu m/s |
| Width | 0 ... Vu m/s |
| ZDR | -8 ... +8 dB |
| TOPS | 0 ... 25.5 km or height configured in Setup |
| VIL | 0 ... 65.0 mm |
| WIND | Configured in Setup |
| SHEAR | +-25 m/s/km |
| HClass | Meteo, Precip,
Cell, Meteo+Precip, and
Meteo+Cell The first Classifiers field lets you to choose which classifier outcomes are projected in the product. The selector lists the available classification algorithms and their merged combinations. |
Color Scale, Levels, 1st Level/Step
The color scale relates numerical data values to colors.
The Scale field lets you choose whether to use a uniform scale with a start value and a constant step, or a custom color scale that has been preconfigured for your system:
-
Custom color scales are defined with the Color Setup utility. See IRIS and RDA Utilities Guide (M211316EN).
Each color scale has a name that has been defined in Color Setup.
Names can reflect scales that are appropriate for different seasons such as Summer or Winter.
If in doubt, select Default which is usually configured to be a reasonable scale. The number of scale steps are filled-in automatically since this is also part of the custom color scale.
-
When you choose a uniform color scale, you pick the number of level steps (2 ... 16). You must also set the following fields:
-
The 1st Level field sets the numerical value used to label the right side of the first level in the color scale for the product.
-
The Step field sets the spacing between the color levels. The numbers in the color legend in the product are spaced by this value.
-
The color scale also associates the classification data to the class descriptors (class identifiers with class legends). Sets of class legends can be customized as Classifier sets in your system (with the HydroClass Name Editor in the Color Setup utility), to match the available classifier methods.
| Display Parameter | 1st Level/Step Format |
|---|---|
| dBZ | + - XX Whole dBZ |
| dBZt | + - XX Whole dBZ |
| Rain | +XXX.X mm/hr |
| Liq | +XXX.X MM |
| Vel | +- X.X m/s |
| Width | + XX.X m/s |
| ZDR | +- X.X dB |
| TOPS | + XX.X km |
| VIL | + XX.X mm |
| WIND | NA |
| SHEAR | +- XX.X m/s/km |
 |
For the mean velocity, selecting a level
step of 0 causes the velocity to be displayed for the entire unambiguous interval between
Selecting an odd number of levels produces a legend with a band centered on 0 velocity. Selecting an even number of velocity levels does not produce a legend with a band centered on 0 velocity, but rather a color break exactly at 0 velocity. |
When choosing a uniform color scale, you have more flexibility to choose colors. The associations of the class identifiers with class legends is fixed by the Color Setup.
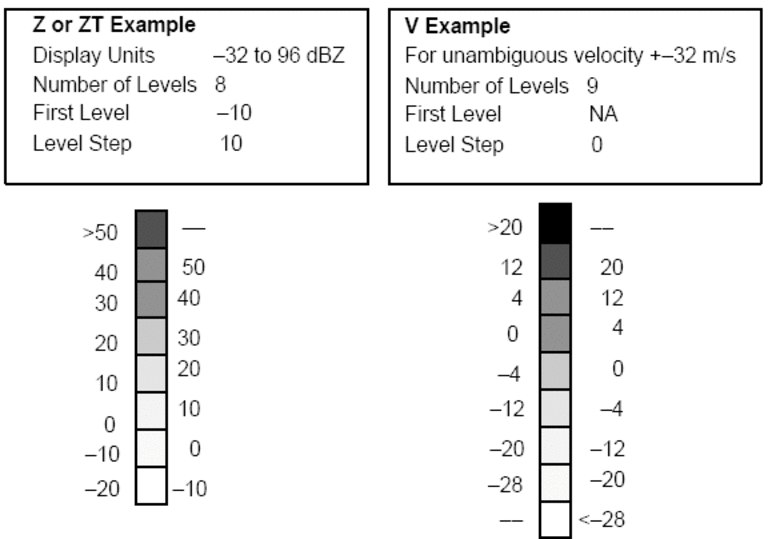
The following figure shows 2 examples of the display configuration parameters, one for ZT and one for velocity, and the resulting color legends that would appear with the product.
In the case of ZT, the example shows that the bottom of the scale "thresholds" such that data
less than -20 dBZ are not displayed, while the top end "saturates" since the top color
includes all values greater than 50 dBZ. When you select uniform scales, the behavior
(saturation vs thresholding) of the end of the scales cannot be changed. This behavior is
inherited from the custom color scale named Default, which is configured in
Color Setup.
In the velocity example, by entering 0 for level step, the display automatically spans the full Nyquist interval. Note that both ends are set to saturate for velocity.
The format of the color legends, with regard to how the numerical legend labels relate to the color band boundaries, is configured in the Color Setup utility for each parameter. This utility offers considerable flexibility for defining how the color legends are constructed for each data parameter. See IRIS and RDA Utilities Guide (M211316EN) .
Product Picture Resolution
|
If you select a custom Map Projection Name (other than <NONE>) you cannot configure this field in the product output menu. This is because the resolution is determined by the projection configuration. |
IRIS can produce product pictures in virtually any resolution, from 16 × 16 to 3100 × 3100 pixels. IRIS products are produced specifically for the display resolution that is requested, optimizing the match between the display pixels and the actual radar data. This means that high resolution products are not merely low resolution products with replicated pixels. Likewise, low resolution products are not produced by degrading a higher resolution product. When you request a high resolution product, you get the best possible image that can be generated from the original data. If a low resolution product is requested, the product is computed efficiently by calculating the product only at the requested resolution. In addition to efficient generation, low resolution products can be transmitted over a communications link and displayed more rapidly because they contain fewer pixels.
The Resolution field in the Product Configuration menus show the X-Y number of pixels. These can be changed by entering different numbers of pixels, or by popping up a menu of the default low, medium or high picture resolutions. The defaults are shown in the following table for both PPI (square image region with legends to the right) and RHI formats (rectangular image region with legends beneath). The defaults are optimized to the resolution of the standard IRIS display devices.
| Default Resolution RHI (Rectangular) Format1 | PPI (Square) Format2 | |||
|---|---|---|---|---|
| X-Pixels | Y-pixels | X-Pixels | Y-Pixels | |
| Low | 240 | 240 | 288 | 136 |
| Medium | 480 | 480 | 600 | 290 |
| High | 720 | 720 | 840 | 530 |
| XHigh | 940 | 940 | 1060 | 750 |
Regardless of the product type, IRIS determines the best way to display your product in either PPI or RHI format. If your image does not exactly match the pixel size of a target display device, IRIS adjusts it to make a best fit. For example, if you output a low resolution image to a high or medium resolution printer, IRIS doubles the pixels so that the display fills the image area. Likewise, IRIS shrinks an image if it has more pixels than can be displayed on an output display device.
If you want the impact of the large screen, but you do not want to burden IRIS with creating high resolution products, specify 360 × 360 display resolution. IRIS doubles these numbers to fit exactly in the large display window.
Likewise, 240 × 240 images are tripled to fit exactly in a large display, or doubled to fit in a medium display.
For more information on data formats, see IRIS Programming Guide (M211318EN).