
Product Parameters
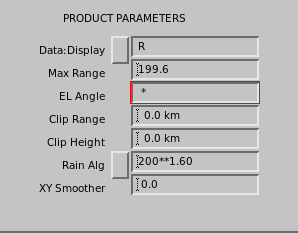
In Product Parameters, define the data taken from the task and how to display the data.
Data : Display
Select Data:Display to show a list of valid display parameter options. The available choices vary depending on the product type.
This parameter specifies from which data parameter the product is derived. For example, Z, V, W, ZT, or ZDR. This information comes from the task associated with the product. Some data parameters can be displayed in more than one way.
| Data type | Description |
|---|---|
|
|
Integral attenuation for horizontal (H) and vertical (V) channels |
|
|
Integral attenuation of ZDR (dB) format |
|
|
Doppler channel clutter-to-signal (CSR) ratio of dBT to -dBZ |
|
|
Total power |
|
|
Clutter corrected reflectivity |
|
|
Uncorrected reflectivity |
|
|
Hydrometeor classification Estimated hydrometeor type in the precipitation area |
|
|
Specific differential phase An indicator of the rate of change of the phase difference between horizontally and vertically polarized pulses of the radar. A greater horizontal shift results in a positive KDP value, and a greater vertical shift results in a negative KDP value. Typical cause for a high KDP area is heavy rain. |
|
|
Linear depolarization ratio H to V (or V to H) The ratio of cross-polar to co-polar reflectivity measured in dB |
|
|
Log receiver signal-to-noise ratio |
|
|
Horizontal (V) or vertical (V) differential phase Phase difference for the total round
trip between radar and the volume where the signal is reflected.
|
|
|
Differential phase The phase difference due to propagation between the HH and VV channels of the radar. |
|
|
Polarimetric meteo index |
|
|
Rate of accumulation of precipitation in units of mm/hour For snow, this is usually refers to the liquid equivalent. |
|
|
Correlation coefficient between HH and VV (or HH & HV / VV & VH) channels Higher (>0.95) values indicate uniform precipitation areas, and lower values indicate more mixed hydrometeor types, such as melting snow, wet snowflakes, or airborne debris. |
|
|
Signal-to-noise ratio Generic measurement of signal-noise ratio in dB |
|
|
Signal quality index A value between 0-1 that measures
the signal's Doppler coherency, that is, the correlation between the signal and its
Doppler lag:
|
|
|
Total reflectivity Total power returned to the radar in reflectivity units. It typically represents the horizontal reflectivity without ground clutter correction. |
|
|
Total vertical (HV enhanced) reflectivity Total reflectivity from the vertical polarization channel (TV) and combination of the horizontal and vertical channel (TE) |
|
|
Velocity Average radial velocity (towards or away from the radar) of detected hydrometeor areas |
|
|
Corrected velocity Same as velocity |
|
|
Velocity and corrected velocity of wind shear |
|
|
Spectral width Variability of Doppler velocity values within the measurement area |
|
|
Polar cross-correlation, uncorrected
Because this value is not noise corrected, this is a direct indicator of the PHIDP uncertainty. |
|
|
Reflectivity Usually referred to as dBZ, this is the common data type that measures radar signal reflectivity, and is used to estimate precipitation intensity from that. All |
|
|
Vertical (HV enhanced) reflectivity Total reflectivity from the vertical polarization channel ( |
|
|
Corrected reflectivity Same as reflectivity
|
|
|
Differential reflectivity The ratio of SNR in the horizontal channel to the SNR in the vertical channel. Positive values indicate more prominent horizontal echoes and negative values more prominent vertical echoes. Larger hydrometeor sizes are usually identified by high positive ZDR values. |
|
|
Corrected differential reflectivity Same as differential reflectivity
|
Product Maximum Range
 |
If you select a custom Map
Projection Name (other than |
This is the maximum range configured for the product, which must be less than or equal to the data range. The maximum range is the range in the E-W / N-S direction centered on the radar. This means that the range to the corners of the resulting display is greater.
Rain Alg
You can choose the algorithm for rainfall estimation from a selection that varies from traditional Z-R relation R(Z) to advanced algorithms for rainfall estimation that use dual-polarization algorithms: R(KDP), R(KDP,ZDR) , R(Z,ZDR), NSSL2005.
The parameters are set in the qpe.con file located at /etc/vaisala/irisrda directory.
| Algorithm | Description |
|---|---|
|
Z-R relation R(Z) |
This algorithm defines R-Z using the traditional
definition: |
|
R(KDP) R(KDP,ZDR) R(Z,ZDR) |
These algorithms compute R using the various dual-polarization parameters. |
| NSSL2005 |
This algorithm uses a rain intensity -based classifier, and different equation for each intensity. For more information on NSSL2005 QPE, see: Ryzhkov, A. V., et. al. Rainfall Estimation with a Polarimetric Prototype of WSR-88D. J. Appl Meteor., 44, 502-515. |
XY Smoother
The XY Smoother can significantly improve the appearance of products for presentation and improve data compression. The smoother performs image processing to average the color contours and interpolate over small gaps or missing pixels in the final Cartesian image.
Specify the length of the smoother in km.
 | CAUTION
Smoothing requires substantial CPU resources. The internal limit on the smoother length is 60 pixels, much longer than you probably want to use. |
To produce many smoothed products in a regular operation, Vaisala suggests the following:
-
Use low resolution products together with smoothing.
It is faster to make a low resolution product and smooth it than to make a medium resolution product and smooth it.
In many cases, the results are nearly identical, so there is no benefit in smoothing high or medium resolution products.
-
Use the minimum smoothing length to get the desired effect. Do not over-smooth and do not use a length that is larger than you need.
Larger smoothing lengths require more computation.