

Displaying SWS Data
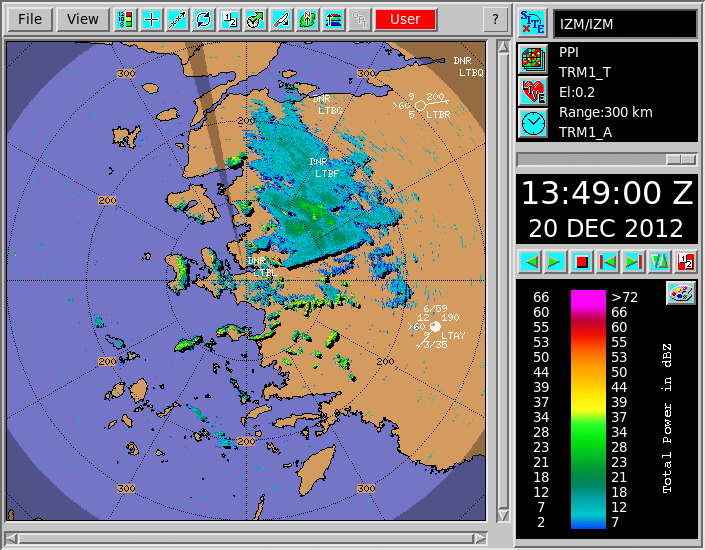
In the previous example, the individual station plots are drawn centered at the station locations. All the stations in the display coverage area are shown.
In the IRIS station plot format, the plot is standardized, although different reporting stations vary in measuring capabilities as well as in data the span and resolution. Individual numbers or graphics are not shown on the plot if a station does report or if the data is turned off in the output options.

The plot details are as follows.
#1 Cloud Coverage
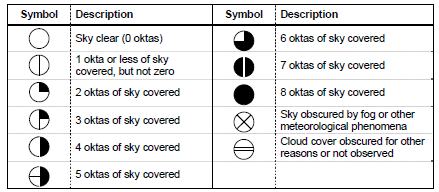
A pie chart showing coverage in oktas (that is, eights) of sky coverage drawn using standard symbols. The example shows 6 oktas.
Because METAR messages do not give cloud cover in oktas units, METAR text is mapped as follows:
| METAR message | Oktas |
|---|---|
| SKC or CLR | 0 oktas |
| FEW | 1 okta |
| SCT | 3 oktas |
| BKN | 6 oktas |
| OVC | 8 oktas |
#2 Wind Barb
A line with feathers showing the wind speed and direction, to the nearest 5 knots.
A knot (nautical mile per hour) is close to half a meter/second, so 20 knots would be 10 m/s. The line points up wind. It has a half feather line for 5 knots, and full length lines for 10 knots, and a triangular flag for 50 knots. If the wind speed is 0, then a circle is draw outside the sky coverage circle.
The example shows a wind of 5 knots from the south.
#3 Present Weather
There is a large set of available symbols, shown in the following figure. The example in Example of Radar Data with an Overlay of SWS Station Plots shows 2 dots, which means light rain.
Matching of METAR present weather text to symbols in METAR Visibility Codes is not necessarily endorsed by the National Weather Service (NWS) or the World Meteorological Organization (WMO).
In the following figure, blue numbers in upper-left corner of white boxes indicate the priority for plotting in event more than one symbol is possible (symbols in gray boxes have no corresponding METAR present weather text). For graphical representation of METARs using this table, see http://www.rap.ucar.edu/weather/surface/

#4 Visibility
This code is a 2-digit shorthand for a somewhat logarithmic scale, as shown in METAR Visibility Codes.
The ">60" in the example means greater than 10 km (6.2 mi).
METAR reports have a maximum value of "greater than 10 km", so you there are many ">60" on the displays.
| Code Value | Meaning |
|---|---|
| 00 | Less than 100 meters (328 ft) |
| 01 ... 50 | Code * 100 meters (100 to 5000 meters (328 to 16 404 ft)) |
| 51 ... 55 | Unused |
| 56 ... 80 | (Code-50) * 1000 meters (3280 ft) (6 to 30 km (3.7 to 18.6 mi)) |
| 81 ... 88 | (Code-74) * 5000 meters (16 404 ft) (25 to 70 km (15.5 to 43.5 mi)) |
| 89 | >70 km (43.5 mi) |
| 90 ... 99 | Unused for land stations |
#5 Temperature
Temperature (°C).
#6 Cloud Height
There can be up to 3 levels of clouds
plotted in the format O/HH.
- The lowest level clouds are drawn below
the station, in this case "
3/40" - The second level of clouds is drawn above
the station, which is "
6/60" in the example - There can be a third level drawn above the second, not shown in this example.
The first number is the oktas of coverage, and the second number is a code value for the height. These code values are similar to the visibility code values, except the units are feet, as shown in the following table.
The example shows 3/8 coverage of clouds at 1219 m (4000 feet), and 6/ 8 coverage at 3048 m (10000 feet). SYNOP reports contain only 1 level of cloud height, so the others are not seen.
| Code Value | Meaning |
|---|---|
| 00 | Less than 100 feet |
| 01 ... 50 | Code * 100 feet (100 to 5000 feet) |
| 51 ... 55 | Unused |
| 56 ... 75 | (Code-50) * 1000 feet (6000 to 25000 feet) |
| 76 ... 99 | Unused |
#7 Sea Level Pressure
Sea Level Pressure in 1/10 of a millibar, with the leading "9" or "10" removed.
If the string starts with a 0 through 4, prefix a "10", otherwise prefix a "9". In the example, this is 1015.0 millibars.
METAR reports the pressure only to the
nearest millibar, so all the numbers end with "0". This pressure is the QNH
pressure, which is corrected to sea level.
#8 Pressure Trend
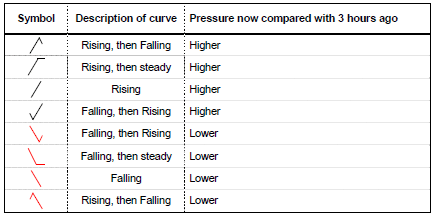
Shows the unsigned change in pressure over the last 3 hours in 1/10 of a millibar. It is followed by a graphic showing the change trend.
For example, "4/" means that the pressure went up by 0.4 millibars in the
last 3 hours.
METAR reports do not contain pressure trend, so this is blank.
The following figure shows the available symbols.
#9 Station ID
- METAR stations use a 4-character string.
- SYNOP stations use a 5-digit number.
#10 Dew Point
Dew Point (°C).