

Cross-Section (XSECT) Tool
The interactive cross-section is a good way to see storm structure and echo heights.
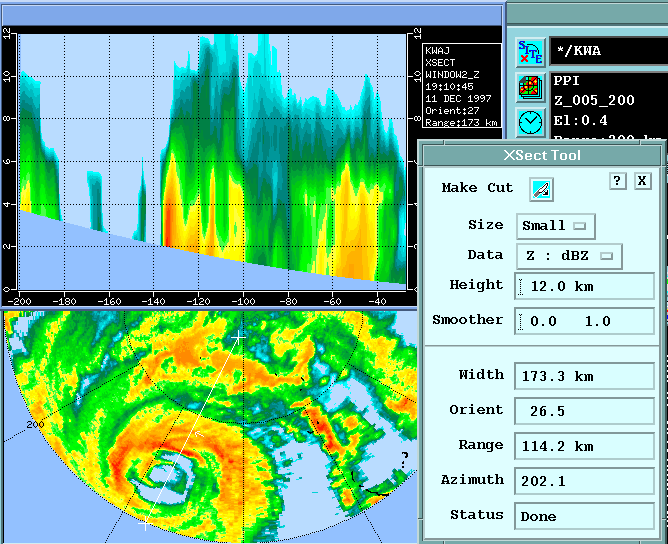
The window at the top left is a small format XSECT window. This appears automatically when you make a cross-section. Note that because the radar cannot see all the way to the surface of the Earth, the bottom of the cross-section is a curved boundary.
The cross-section line is shown on the display. The small arrow at the center of the line shows how you see the cross-section. In this case the cross-section is viewed from the east through the eye of the typhoon.
The XSECT tool, shown on the right, allows you to configure nearly all aspects of the cross-section.
Cross-Section Display Color Scales
The cross-section uses the color scale configured in the Color Scale tool for the data type that is being displayed.
The cross-section and base product color
scales match if they have the same data type. For example, if you ask for a cross-section of
dBZ and the base product is dBZ, the color scale of the
cross-section match the input product.
If you want to change the color scale in the
cross-section, use the Color Scale tool and select the data type
(dBZ, V, and similar). Then re-make the
XSECT. The new colors are applied when the cross-section is
re-made.
Cross-Section Range Scale
The height range scale is either km or thousands of feet and the horizontal range scale is either km or nautical miles according to the units selection in the Display Options tool.
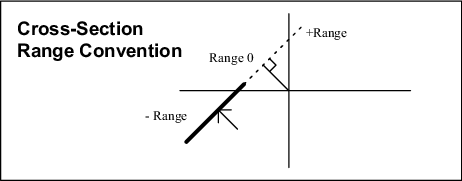
The origin (range zero) corresponds to the point on the line or its extension that is closest to the radar. That is, the origin is the point where the line or an extension of the line would be at a right angle to a line drawn from the radar.
 Cross-Section Display in
Standard Window
Cross-Section Display in
Standard Window
To display cross-sections in a standard window select an XSECT product.
The cross-sections inherit the name of your window and the data type when they are listed in the product selection tool.