

Cursor Tool
You can use the Cursor tool to show the value of data at a point and the geographic position of the point. In addition, the position of the cursor relative to another "home" point (range and bearing) are displayed.
You can select the "home" point from a pre-defined list that always includes the radar, or you can "plant" it interactively.
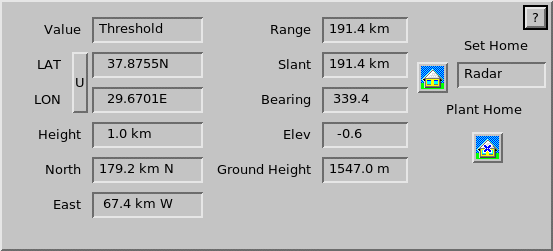
- Value
- Shows the value at the current position. The units are the same as those displayed in the image.
- Latitude and Longitude
- Show the latitude and longitude of the position to the nearest tenth of a minute.
- Height
-
Shows the height above the curved surface of the Earth at the cursor position. 1
Not all displays have a height, VIL for example. In these cases, a value of
0.0is displayed for height. - North
-
Shows the North–South distance from the "home" point to the cursor position. 1
- East
-
Shows the East–West distance from the "home" point to the cursor position. 1
- Range and Slant Range
-
Range shows the range along the curved Earth's surface relative to the "home" point (usually set to be the radar). 1
Slant shows the range along the radar beam. 1
Not all displays have an associated Slant range because there may be no elevation angle associated with the product. VIL is a good example. In these cases, the Slant is displayed as
0.0. - Bearing
- The bearing in degrees from the Home point to the cursor as measured clockwise from true north.
- Elevation
-
For products that have an associated elevation, this displays the elevation angle from the home point to the cursor.
Any product that has a "height" also has an elevation (for example, PPI and CAPPI).
If the "home" point is relative to the radar, the elevation is the elevation angle of the radar.
If the "home" point is not the radar, the elevation is the elevation angle that an observer at that point would observe to see the cursor at its height.
- Ground Height
-
Displays the height of the ground above sea level at the location of the cursor.
To use Ground Height, you must add Digital Elevation Model (DEM) data in GeoTiff format in the usr/share/dt directory with the filename dem.tif. The DEM data should cover the geographical domain scanned by radars within the network. Good quality DEM data in GeoTiff format is available at, for example: http://srtm.csi.cgiar.org.
 |
You can use cursor with other tools such as the Loop or Track tools. However in some cases, the mouse is reserved for other functions. You can still get readouts from the cursor tool by displaying it first and then selecting Track. The cursor is not displayed on the screen, but the readouts correctly reflect the values where you are pointing. |
You can move the cursor in the display by clicking your mouse, or dragging the cursor. The values in the menu update as you move the cursor.
Units in
the Display Options tool. See in Display Options Tool - IRIS Product Output.