

Forecast Tool
Use the Forecast Tool to shift products into the future to see the forecast position of weather features.
In the following example, the dark outer region represents the area not scanned, while the inner lighter circle represents the scanned area. The radar image is shifted 3 hours for an assumed motion of 24 knots at 43°.
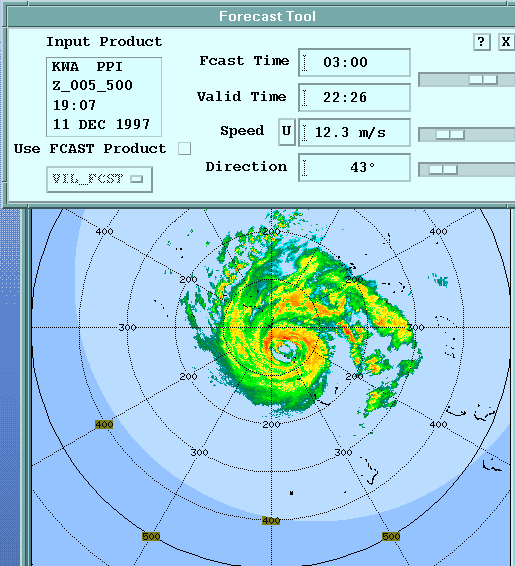
The image can be shifted in the following ways:
-
User Input
The forecaster inputs a speed and direction as was done in the example.
The echo is shifted by a constant speed and direction. This is shown in the example above.
-
FCAST product (IRIS or user Forecast product)
Forecast products can be produced either by IRIS or by external programs that create forecast products and insert them into IRIS.
The echoes can be subjected to both a non-uniform motion field and a non-uniform intensity change field.
The IRIS FCAST product computes a uniform wind field based on the average echo motion as calculated from a 2D cross-correlation of the current and previous image. No intensity change is calculated. Check with your system manager to see what FCAST products are available on your system.
User Input Forecast
If you have obtained a nominal speed and direction from the manual track product, you can do a manual forecast projection with the following settings:
- Use FCAST Product button clicked out.
- Speed and Direction are set manually by type-in or slide pot.
- FCAST Time is set to how far ahead you want to look.
- Valid Time displays the time at which the forecast is valid, that is, the data time of the display plus the Forecast Time
FCAST Product Forecast
- Select Use FCAST Product.
- Select the forecast product, if any are available, from the option widget.
In this case the speed and direction are taken from the forecast product and the user input fields are desensitized.
The FCAST algorithm in the Quick Look Window takes as input a product and a forecast product (array of motion vectors and intensity changes).
The steps involved in the forecast are as follows:
- An output array is created with the same projection and resolution as the input product (for example, an input CAPPI that we want to forecast).
- The forecast product motion vectors and intensity change array points are re-mapped onto the output array. This re-mapping means that the input product and the forecast product do not have to have the same projection, resolution, or range.
- Usually there are many more output array pixels than there are grid points in the forecast product. Therefore it is necessary to interpolate the spares motion vector and intensity change points to each pixel point (pixel) in the output array. The result is that each pixel of the output array has a motion vector and an intensity change associated with it.
- For each pixel of the output array, the motion vector is used to "look back" in time per the selected forecast time. This "backwards displacement" vector points to a pixel in the adjusted input product. The value of this pixel is then used for the output product pixel.
- The intensity changes in the output array are applied pixel-by-pixel to adjust the data for growth and decay.