

Color Scale Tool
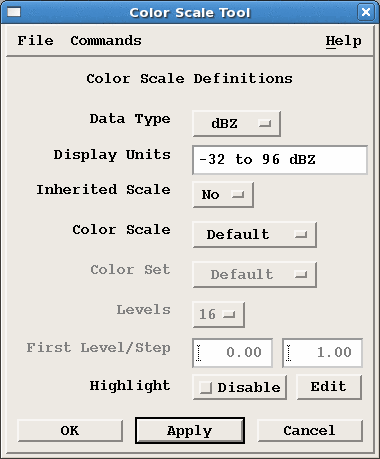
The Color Scale Tool in the color legend lets you select different color scales that have been configured in your system in the Color Setup utility or create your own custom scale.
- To open the Color Scale Tool, select the Color Scale icon.
-
Choose the Data Type for which you want to define a color
scale.
Display Units shows the units of measurement for the data type that is currently selected.

When you first enter the Color Scale Tool, the data type does match what is displayed in the window. -
Select a custom Color Scale.
Custom scales are defined by the system operator in the Color Setup utility. There are up to 8 scales for each data type. These scales include the choice of color set, number of colors, and data levels for each color.
The existing color scales remain intact in the software upgrades.
When installing fresh software, a default color scale and the choice Uniform are available for each data type. In addition, the color scales Winter and Everything are pre-configured for the reflectivity data types, for the purpose of matching varied seasonal and application needs.
The Default color scale of the
HClassdata corresponds to the class set of the legacyHydroClass. TheHClassdata type includes additional color scalesPRECIP,CELLS,METEO, andMETEO-CELLS, which correspond to the multiple Classifier methods (and their meaningful mergings) available in IRIS/RDA.The choice of Uniform has a special meaning: you can interactively select the color set, number of colors, and start and step levels. This is convenient for simple thresholding out low and/or high data values, as well as for the simplest mergings of echo classes of
HydroClass. -
If you are in uniform mode:
-
To highlight a data interval to see if that data is on your display, select and then Edit .
The Highlight Tool starts. See Highlight Tool.
-
Select to save your results.
The results are saved for only the window where you are working. You cannot affect other windows. You may want to go to the other windows and make similar changes and save them.