Highlight Tool
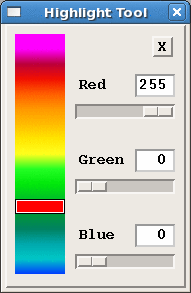
The Highlight Tool, launched from the Color Scale Tool, lets you highlight one particular data interval to see if that data is on your display.
Use this tool to select color intervals (from the 16 intervals in the legend). You can set the color for that interval using the color scroll bars. Those data values on the display are shown in the new color.