

VVP Output Options: Time-Height
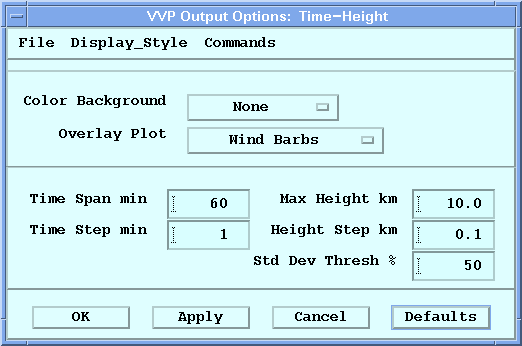
You can use the Time-Height Output Options to show a height against time cross-section of VVP parameters with the specified color background and overlay plot.
The VVP product shows vertical profiles of average Doppler wind properties over the radar such as wind speed, wind direction and divergence. The Output Options menu lets you choose to display wind data in one of the following ways:
- Choose to display a graph of VVP parameters against height at a single time. You can select 1, 2, or 3 graphs.
-
The WIND product plots the horizontal wind speed and direction.
For this product type, you can choose whether to display all wind measurements or only those winds that deviate from the mean.
You can choose either wind barbs or wind strings to represent wind speed and direction, and you can specify a coverage threshold percentage.
- Check that VVP is the current product type.
-
Select Options.
The Time-Height Output Options menu is shown.
-
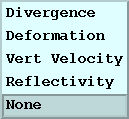
In Color Background, choose the information that you want
displayed in the background.
-
In Overlay Plot, Choose the type of overlay plot.
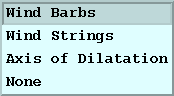
- Wind barbs use the standard meteorological convention of 1/2 barb for 5 knots, 1 barb for 10 knots and triangles for 50 knots.
-
Wind strings point away from the wind direction, with the length of the string indicating the relative wind speed.
You can set the maximum length of the wind strings using the for wind speed.
-
Axis of Dilatation lines show the angle of "stretching".
Fronts tend to form parallel to this angle. The length is proportional to the deformation which indicates the strength of the stretching.
You can set the maximum length of the dilatation using the for deformation.
- Select None if you do not want to display an overlay plot.
- In Time Span min, set the duration of the time (horizontal) axis in minutes.
-
In Time Step min, set the minimum time step for plotting data.
This is useful to avoid collisions of the wind barbs when the data are closely spaced. Type 0.0 to see all the data.
For example if there is a VVP profile every 5 minutes and this field is set to 10, then every other profile is plotted.
-
In Max Height km, type the maximum height (vertical scale) that
you want to display.
Note that the height of the VVP profile may be less than the height that you display, in which case a blank background color is shown.
-
To avoid collision of the wind barbs in height, you can specify Height Step
km.
Type 0.0 to see all the data.
-
In some cases, the wind estimates are noisy because of weak signals or poor coverage.
If needed, use Std Dev Thresh % to threshold poor estimates so that
they are not displayed.
Specify a number between 0 (no thresholding) and 100 (everything thresholded away). Typically a value of 80 is used.
-
To test your setting, select Apply.
The velocity point is displayed if the following is true: