

VVP Output Options: Line Graphs
VVP products can be displayed in graphical format of VVP wind profile parameters against height. 1, 2, or 3 graphs may be plotted side-by-side.
- Use the Product Selection tool to select a VVP product.
-
Select the Options icon to show the Display
Options menu.
Make sure the Product Type is VVP.
-
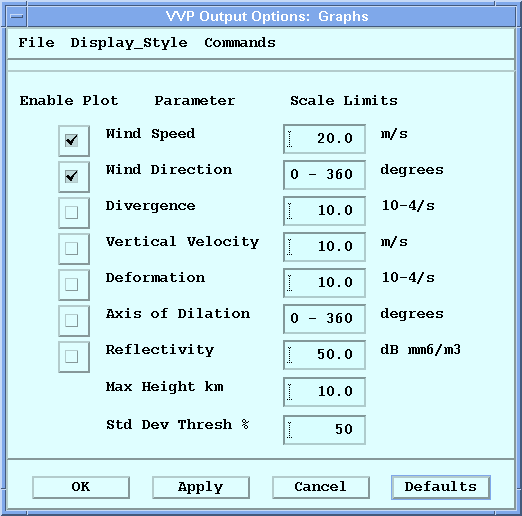
Select Options to show the VVP Output
Options menu.
Either the Graphs or the Time Height submenu is shown.
- If Time Height is shown, select .
-
Make your changes by enabling the plot parameters you want to use and typing relevant
values in the Scale Limits column:
- Wind Speed
-
Select to chart the wind speed in the graph.
Type a value to specify the maximum wind speed you want to plot.
- Wind Direction
- Select to chart the wind direction. You cannot edit the Scale Limits column for this field.
- Divergence
- Select to chart the wind divergence. Type a value to specify the maximum divergence you want to plot.
- Vertical Velocity
- Select to chart the vertical velocity. Type a value to specify the maximum vertical velocity you want to plot.
- Deformation
- Select to chart the horizontal deformation. Type a value to specify the maximum deformation you want to plot.
- Axis of Dilation
- Select to chart the axis of dilatation. You cannot edit the Scale Limits column for this field.
- Reflectivity
- Select to chart the reflectivity. Type a value to specify the maximum reflectivity you want to chart.
- Max Height in km
- Type the maximum height for the data to include in the plot.
- Std Dev Thresh %
- Enter the standard deviation threshold percent for the data to include in the plot. This is used to threshold poor estimates. The scale goes from 0 (no thresholding) to 100 (total thresholding). 80 is a typical value.

Alternatively, select Defaults to use a reasonable set of default values as a starting point. -
Select Apply.
Your changes are shown in the current VVP display as a graph.
- Select .