

BEAM: Antenna Beam Pattern Product
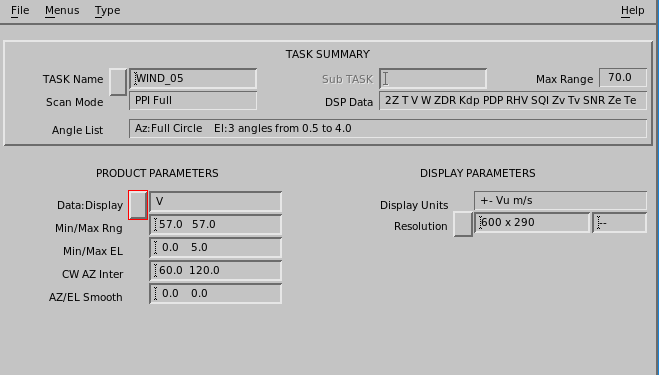
BEAM is a full screen cross-section format image showing range-averaged intensity in azimuth and elevation coordinates.
The BEAM product is similar to a cross-section in that it shows a quasi-vertical slice of the atmosphere. It is constructed from a PPI volume scan. The product is used primarily for system testing and evaluation purposes, such as:
- Antenna beam pattern testing. Typically a radiator is on a tower a few km from the radar. The radar is then scanned in sector or full PPI mode around the target using high resolution (for example, <0.5°) spacing in AZ and EL. The transmitter is typically turned off for this. The BEAM product can then be used to display the antenna response to the radiator.
- Calibrated sphere measurement. Similar to above except the radar is radiating. The sector scan is made about the calibration sphere which is typically suspended from a tethered balloon. The resulting display shows the location and returned power from the sphere. This can be used for full system calibration.
At near horizontal incidence (low elevation angles), the BEAM product is similar to a cross-section. Since the product can be configured to average a range interval, the BEAM product can give a picture of the weather or other targets in a spherical "slab" defined as a range, azimuth and elevation interval. The cross-section on the other hand, attempts to show a planar "slice" through the weather.
- Select .
- In Data:Display, choose Z dBZ, V V, W W, or T dBZt.
-
In Min/Max Range, Select the range interval over which averaging
is performed.
The BEAM product performs averaging of dBZ or dBT values without linearizing. All distances are in km.

IRIS has a selectable maximum height above which data are not recorded (for example, 20 km (12.4 mi)). When selecting the Min/Max Range range, consider that, at far ranges, this height is exceeded in the upper angles of a volume scan.
For example, if the height cutoff is set to 20 km (12.4 mi), and a volume scan uses elevation angles up to 20°, the maximum range that includes all of the data is 55 km (34.2 mi).
-
In Min/Max E L, define the elevation window.
For example, if the volume scan has elevation angles between and including 0 and 5°, enter the values 0.0 and 5.0.
-
In CW AZ Interval, define the azimuth window.
The first value corresponds to the left side of the display, the second value to the right side of the display.
From left to right on the display, the angles are in the clockwise direction.
For example, clockwise interval of 0.0 to 90.0 represents a 90° sector, while the interval 90.0 to 0.0 represents a 270° sector.
-
Apply the AZ/EL Smoother.
Enter the values in degrees, first for the azimuth and then for the elevation direction.
Typical values are 1.0, 1.0.