

HMAX: Height of Maximum Intensity Product
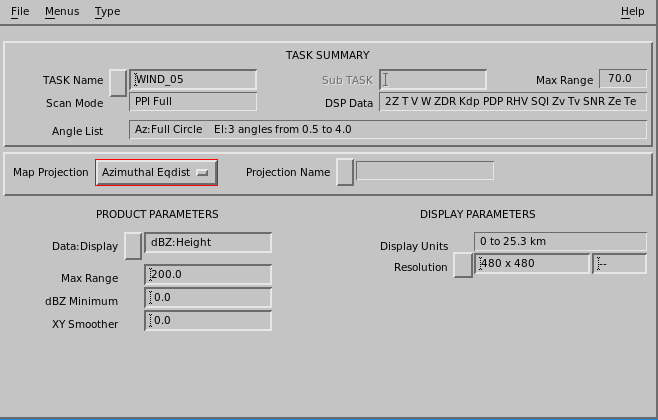
HMAX displays the height of the maximum data above each output pixel.
It is similar to the MAX product which shows the value of the maximum reflectivity over each pixel. The HMAX algorithm requires a volume scan. It searches vertically through the elevation angles above each output pixel and determines the height of the maximum intensity.
The product can in some cases show the presence and height of the bright band. In animation, rapidly decreasing heights in convective storms may indicate the presence of a microburst. A limitation of the HMAX product is described in the note below:
 | A limitation of this product is that the heights are quantized by the number of elevation angles. It is not possible to interpolate the maximum, so the height is the height of the elevation angle where the maximum occurs (with earth curvature correction). Using a volume scan with many elevation angles and the 2D Cartesian smoother both help to mitigate the effects of this quantization. |
- Select .
-
In Data : Display, select one of the following:
- dBT Height
- dBZ Height
- dBZc Height
- In Max Range, select the maximum range for the product.
- In dBZ Minimum, select the smallest maximum reflectivity for which to show height.
-
Apply the AZ/EL Smoother.
Because of the quantization of the heights by the elevation steps in the volume scan, you may want to try a longer smoother than you would typically use to help smooth over the quantization (for example, 3.0 km (1.9 mi)).