

XSECT: Cross Section
XSECT is a volume scan product that shows the height cross-section along a user-definable line.
The XSECT product is similar to an RHI in that it shows a range-height representation or vertical "slice" of a radar parameter.
For XSECT, the cross section is constructed from a PPI volume scan. This means that if you are running a standard volume scan at regular intervals, an XSECT can be constructed without scheduling an RHI task.
Unlike RHI products, which are typically composed of about 100 elevation angles, the resolution in an XSECT is limited by the number of elevation angles in the volume scan, typically 10 ... 20. However, the 3-D interpolation used by the XSECT algorithm yields an excellent representation of the height distribution of radar parameters. The algorithm also corrects for earth curvature effects so that the height scale corresponds to the actual height above your product reference height (usually sea level).
You can use the XSECT product in the following ways:
-
For regions of interest, such as a watershed area or air terminal, you may configure an XSECT as a standard product to slice through the area.
-
On an ad hoc basis to cut through a line of storms or an area of suspected severe weather.
For ad hoc cross sections, use the XSECT tool on the Quick Look Window to configure the cross section line with a mouse.
If you do not use the mouse to define a cross section line, display a PPI or CAPPI product with range rings and range numbers to help you configure the cross section.
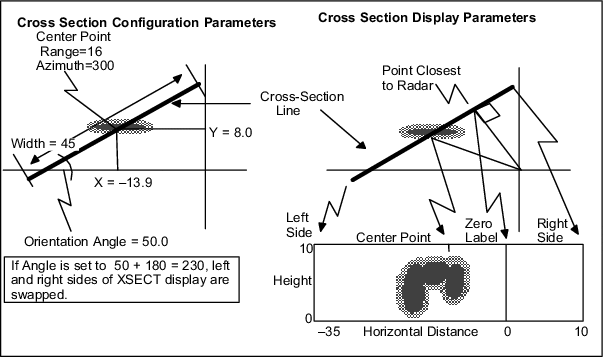
The following figure shows the XSECT corresponding geometry for the previous configuration example.
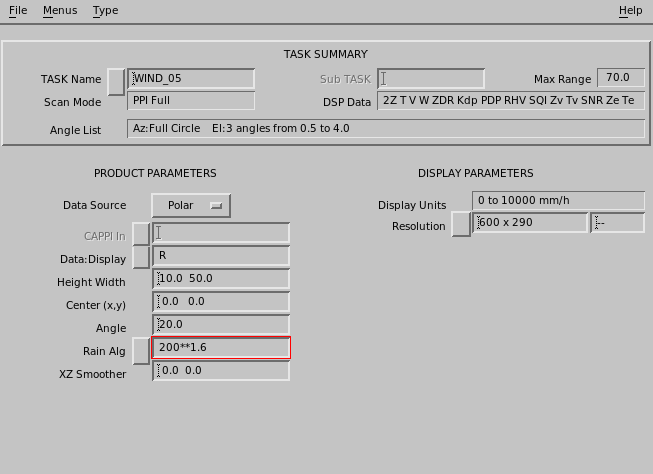
- Select .
- In Data:Display, choose from: Z dBZ, Z Rain, V Vel, W Width, T dBZt, T Rain, Zd ZDR, and Zd Rain.
-
For Center (x,y):
-
Select the maximum height and the horizontal width of the cross section in km and enter
them in Height Width.
There is no need to be exact, use the range and azimuth marks that are on the display to estimate the horizontal width.
In the example, the height is 10 km (0.6 mi) and the width is 45 km (28.0 mi).
-
In Angle, select the orientation angle in degrees.
In the example, the angle is 50°. The angle that you select determines the end of the cross section slice that is displayed on the right side of the display. An angle of 50° displays as follows:
Left Side         Right Side
23° end           50° end
To reverse the ends in the output display, select an angle of 50° + 180° = 230°.
-
In XZ Smoother, set the X and Z smoothing length scales
independently.

Because of the interpolation performed in constructing the cross section product, the output displays usually require little, if any, smoothing. In the final output display, the zero point of the horizontal range scale corresponds to the point on the cross section closest to the radar. This is also shown schematically in the example.
This means that if you select a line that goes through the radar (which is allowed to make a pseudo RHI), the 0 point is at the radar, so the horizontal distance equals the radar range.