VIL: Vertically Integrated Liquid
VIL is a color-coded map of the estimated depth of water (in mm) contained in a selectable atmospheric layer. This is an excellent indicator of severe storms.
Either Z or ZT can be used as the basis for the estimate.
VIL can compute several different values over an altitude interval or layer in the atmosphere, including integrated liquid, or averaged reflectivity. These can be excellent indicators of severe storm activity, especially with regard to the rainfall potential of a storm.
Because VIL can be set to look over the entire depth of the atmosphere, it is good at seeing precipitation aloft that is not reaching the ground, which can be missed by a PPI or CAPPI.
If the layer height is above the freezing level, high VIL values are an excellent indicator of severe storms and hail. If the layer height extends from the surface up to 3 km (1.9 mi), then the VIL values serve as a forecasting guide as to how much precipitation is likely to fall during the next few minutes.
When computing integrated liquid data (VIL-data), the output shows the estimated precipitation (in millimeters) contained within the user-defined layer. This number is sometimes also labeled in kg/m**2.
-
The VIL algorithm first searches out all points in the layer (accounting for earth curvature) over a given range and at a given azimuth that intercept the PPI scans of the volume scan, including one point above and below.
-
The algorithm converts the Z or T values to W (water content) values and integrates the values in the layer.
Each data point is assigned a weighting corresponding to the height interval that it represents in the layer. The result is an intermediate PPI product that has the total water content as a function of surface range and azimuth.
- Finally, the intermediate product is transformed to Cartesian and stored. If Z is selected as the Product Data parameter, but at run time only T is available (or the other way around), the product runs with the available data parameter.
When computing Layer Average Reflectivity
(LAR-data), the output is stored in normal reflectivity. The processing is nearly identical
to VIL-data, except that the dBZ inputs are
converted to linear Z instead of W, and we divide by the layer thickness in the end. The average Z is then converted back to dB.
- Select .
-
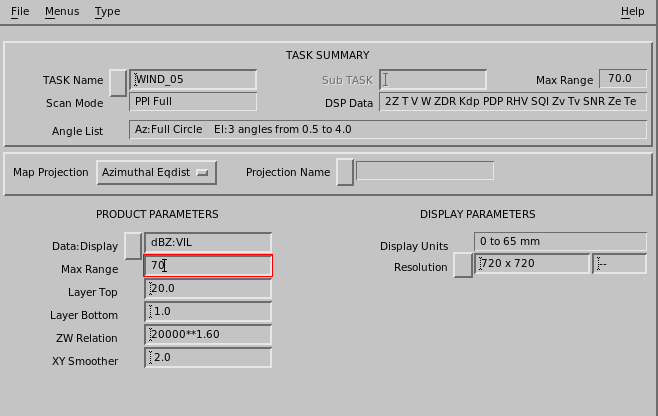
In Data:Display, select which type of data is computed.
- dBT:VIL Select input type to compute VIL data.
- dBZ:VIL
- dBZc:VIL
- dBT Select input and output type to compute the layer average.
- dBZ
- dBZc
-
In Layer Top and Layer Bottom, select the
top and bottom heights of the VIL layer in kilometers and tenths of
kilometers.

Caution The bright band biases the VIL measurements. Select the VIL layer to avoid the freezing level height. -
In ZW Relation, select the reflectivity-water content
(
Z-W) relationship.This field is desensitized if we are computing a reflectivity based product rather than a water based product. A default value for rain is provided. For snow, reduce the coefficient to a smaller value, such as 2000, to account for the lower reflectivity of ice.
VIL can function when only one angle is in the task, but this is not recommended for best results. If no angle in the associated task passes through the VIL layer, no VIL can be calculated.
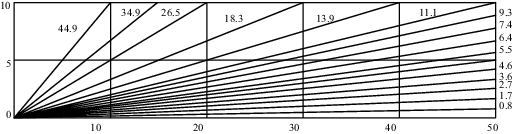
For a VIL layer of 5 to 10 km (3.1 to 6.2 mi), in the volume scan example in the following figure, VIL cannot be calculated for ranges less than 5 km (3.1 mi). In the resulting product display, black would be displayed in this region to indicate that IRIS did not even sample the region.
Figure 2. Example of 15-tilt Volume Scan