

MAX: Maximum Data with Side Panels
MAX shows the maximum data over each pixel as well as the East-West and North-South maximum projects in side panes.
The MAX product provides an easy-to-interpret presentation of the echo height and intensity in a single display. It is especially useful for displaying areas of severe weather.
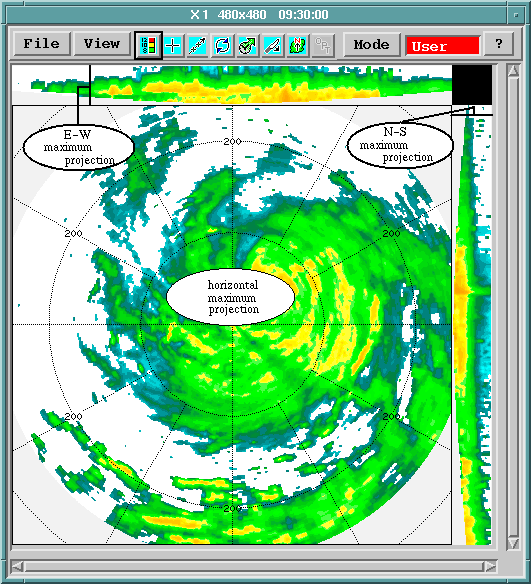
 | Because the radar cannot see to the surface of the Earth, there are curved boundaries at the bottom of the side panels. |
MAX is based on a volume scan task and is calculated as follows:
-
Construct a series of CAPPI products to span the selectable layer, spaced uniformly over the height interval. The number used is the larger of one for every 500 meters (1640 ft 5 in) or one for every 2 pixels of side panel size, up to a maximum of 50. The values are interpolated to create the side panel image.
-
Determine the maximum data values for the horizontal and vertical projections: East-West and North-South.
-
The horizontal maximum projection is calculated from the highest data value in a user-specified layer over each pixel.
-
The E-W maximum projection is obtained from the maximum data for each pixel along the corresponding N-S line.
-
The N-S maximum projection is obtained from the maximum data along E-W lines.
-
-
Smoothing, if enabled.