

Configuring Map Projections

You can specify the type of map projection that is used for display. This is useful for combining data from other sources or for generating displays that are not centered on the radar.
Composites, for example, must use a projection so that the data from several radars can be mapped to a single display.
| Projection | Description1 |
|---|---|
| Azimuthal equidistant (AED)2 |
Choose this for a standard radar display map where azimuth lines are straight and angles are not distorted. This projection has the property that the distance in the map horizontal direction is the same as the distance in the map vertical direction. This means that lines of constant azimuth (radar rays) are straight and circles can be used to represent lines of constant range. Because of this, the AED projection is particularly convenient for radar applications. For radar applications, the radar is usually placed in the center of the map and the radar location serves as the map reference point. Note that lines of latitude and longitude are not straight in this projection. (Page 191) In IRIS Focus this is used to display single radar data. |
| Mercator2 |
Choose this for true Mercator projection mapping where latitude and longitude lines are straight and intersect at right angles. Additionally, a line of constant bearing from a point is straight so it is useful for navigation. Mercator has the advantage that it is a known standard, so it is easier to combine data from different sources onto a Mercator projection. It has the disadvantage that at high latitudes, the horizontal and vertical scales are different (large distortion). (Page 38) In IRIS Focus this is used to display composite radar data. |
| Equidistant cylinder |
Used for the digital terrain maps in IRIS (for example, inserted in the Overlay utility). (Page 90) |
| Gauss conformal |
Same as Universal transverse Mercator except omitting the 0.9996 scale factor. (Page 48) |
| Gnomonic |
All great–circle arcs are straight lines. (Page 164) |
| Lambert conic |
Scale is true along 2 standard parallels. (Page 104) |
| Perspective |
Often used for satellite images. We assume that the satellite is at geosynchronous height. (Page 169) |
| Polar stereographic |
Useful near the North Pole. This is essentially the AED projection with the reference point at the North Pole. (Page 154) |
| Universal transverse Mercator (UTM) |
A projection just like Mercator with the axis reversed at a selectable longitude. The horizontal dimension is compressed by a factor of 0.9996. By convention the reference longitudes should be multiples of 6°. Used by the military, and is good for regions with long North-South extent. (Page 48) |
-
To configure a standard radar display centered on the radar:
- For the projection type, select .
- For the Projection Name, select <NONE>.
-
To use a pre-configured projection, select .
- A list of available projection files on the system is shown.
- In the example, the radar Max Range and Output Pixel Resolution are desensitized since they are defined by the projection file that is selected.
- Select <NONE> for the Projection Name in which case the radar is defaulted to be at the center of the screen. Additionally in the case of an AED projection, the radar is defined to be the map reference point. In this case, the Max Range and Resolution fields are configurable in the Product Configuration Menu.
-
To configure your own projection, select .
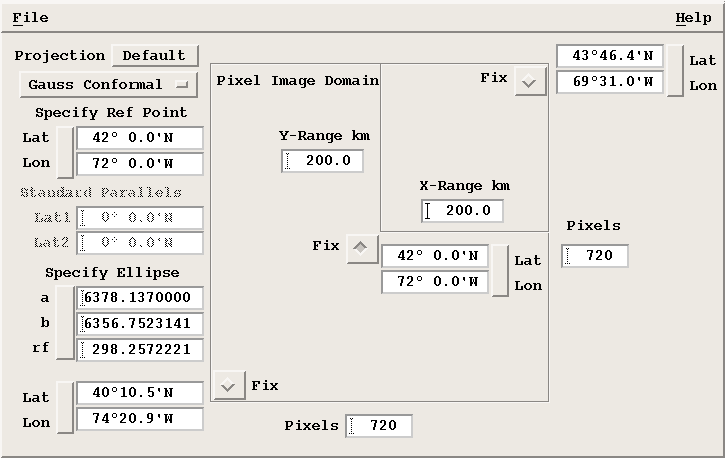
The Projection Configuration Menu opens.
-
Select the Projection to define the projection type.

You must first define the projection. The list of available projection files under File is given only for the selected projection type. - Select command to give a list of existing Mercator or AED files depending on the selected projection.
-
Select Reference Point.
-
For AED projections: The reference point is the location from which all azimuths display as straight lines. Usually set to the radar location.
-
For Mercator projections: The map cannot cross the line 180° away from this longitude, so set it near your location. The latitude defines the range scale.
-
For Polar Stereographic: The is the longitude line which you wish to have vertical in the map. Effectively this rotates the map. Again the latitude defines the range scale.
-
For UTM: Only a longitude is selected. This is the center meridian of the UTM strip. By convention these are spaced every 6°, starting at 3°. Use a value near your longitude.
-
For Lambert Conic: Also define 2 standard parallels.
-
-
Select Save to name your projection.
The name of the open projection file is displayed in the menu title bar (AED_200_KM in the example).
-
Fix a corner or center location.
To configure a projection, you must know the latitude and longitude of either the NE or SW corner or the center of the display.
Select Fix at the location that you know and then input the LAT/LON coordinates.
With Fix selected, you can change other parameters of the projection geometry without losing you coordinate information.
-
Specify the projection coverage area (region of the projection) in one of 2 ways:
- Specify the latitude and longitude of one of the 2 unfixed points.
- Specify the distance North (Y-Range) and the distance East (X-Range) from the center.
The projection menu acts as a spread sheet. When you change a parameter, the other parameters adjust to reflect the change.
The spreadsheet algorithm converges on a correct solution even for strange projections. One example where it may not converge is for an AED projection where the Reference Point is several thousand kilometers from the center of the projection region.
If you encounter a problem with the spreadsheet, check the reference point and select Default to load some valid numbers.
-
Specify the pixels.
The number of pixels that are used to represent data in the projection is specified for the X- and Y-directions of the output display.
If you have specified the other aspects of the projection, input the correct number of X-pixels (horizontal direction). The number of Y-pixels adjust automatically.
If you adjust the number of Y-pixels, then other parameters of the spread sheet change, such as the LAT/LON of the unfixed points and the Y-Range.
-
Fine-tune the spread sheet.
Since all of the projection geometry parameters are linked through the spread sheet algorithm, when you change one parameter, other parameters adjust automatically.
This means that you may need to compromise. The spread sheet makes it easy to experiment with different compromises.
For example, if you want a 480 × 480 pixel Mercator display, both the X- and Y-ranges cannot in general be made equal (for example, 100 km (62.1 mi)). In this case, the compromise can be, for example, an X-range of 100 km (62.1 mi) and a Y-range of 99.5 km (61.8 mi) to get a perfect 480 × 480 display.